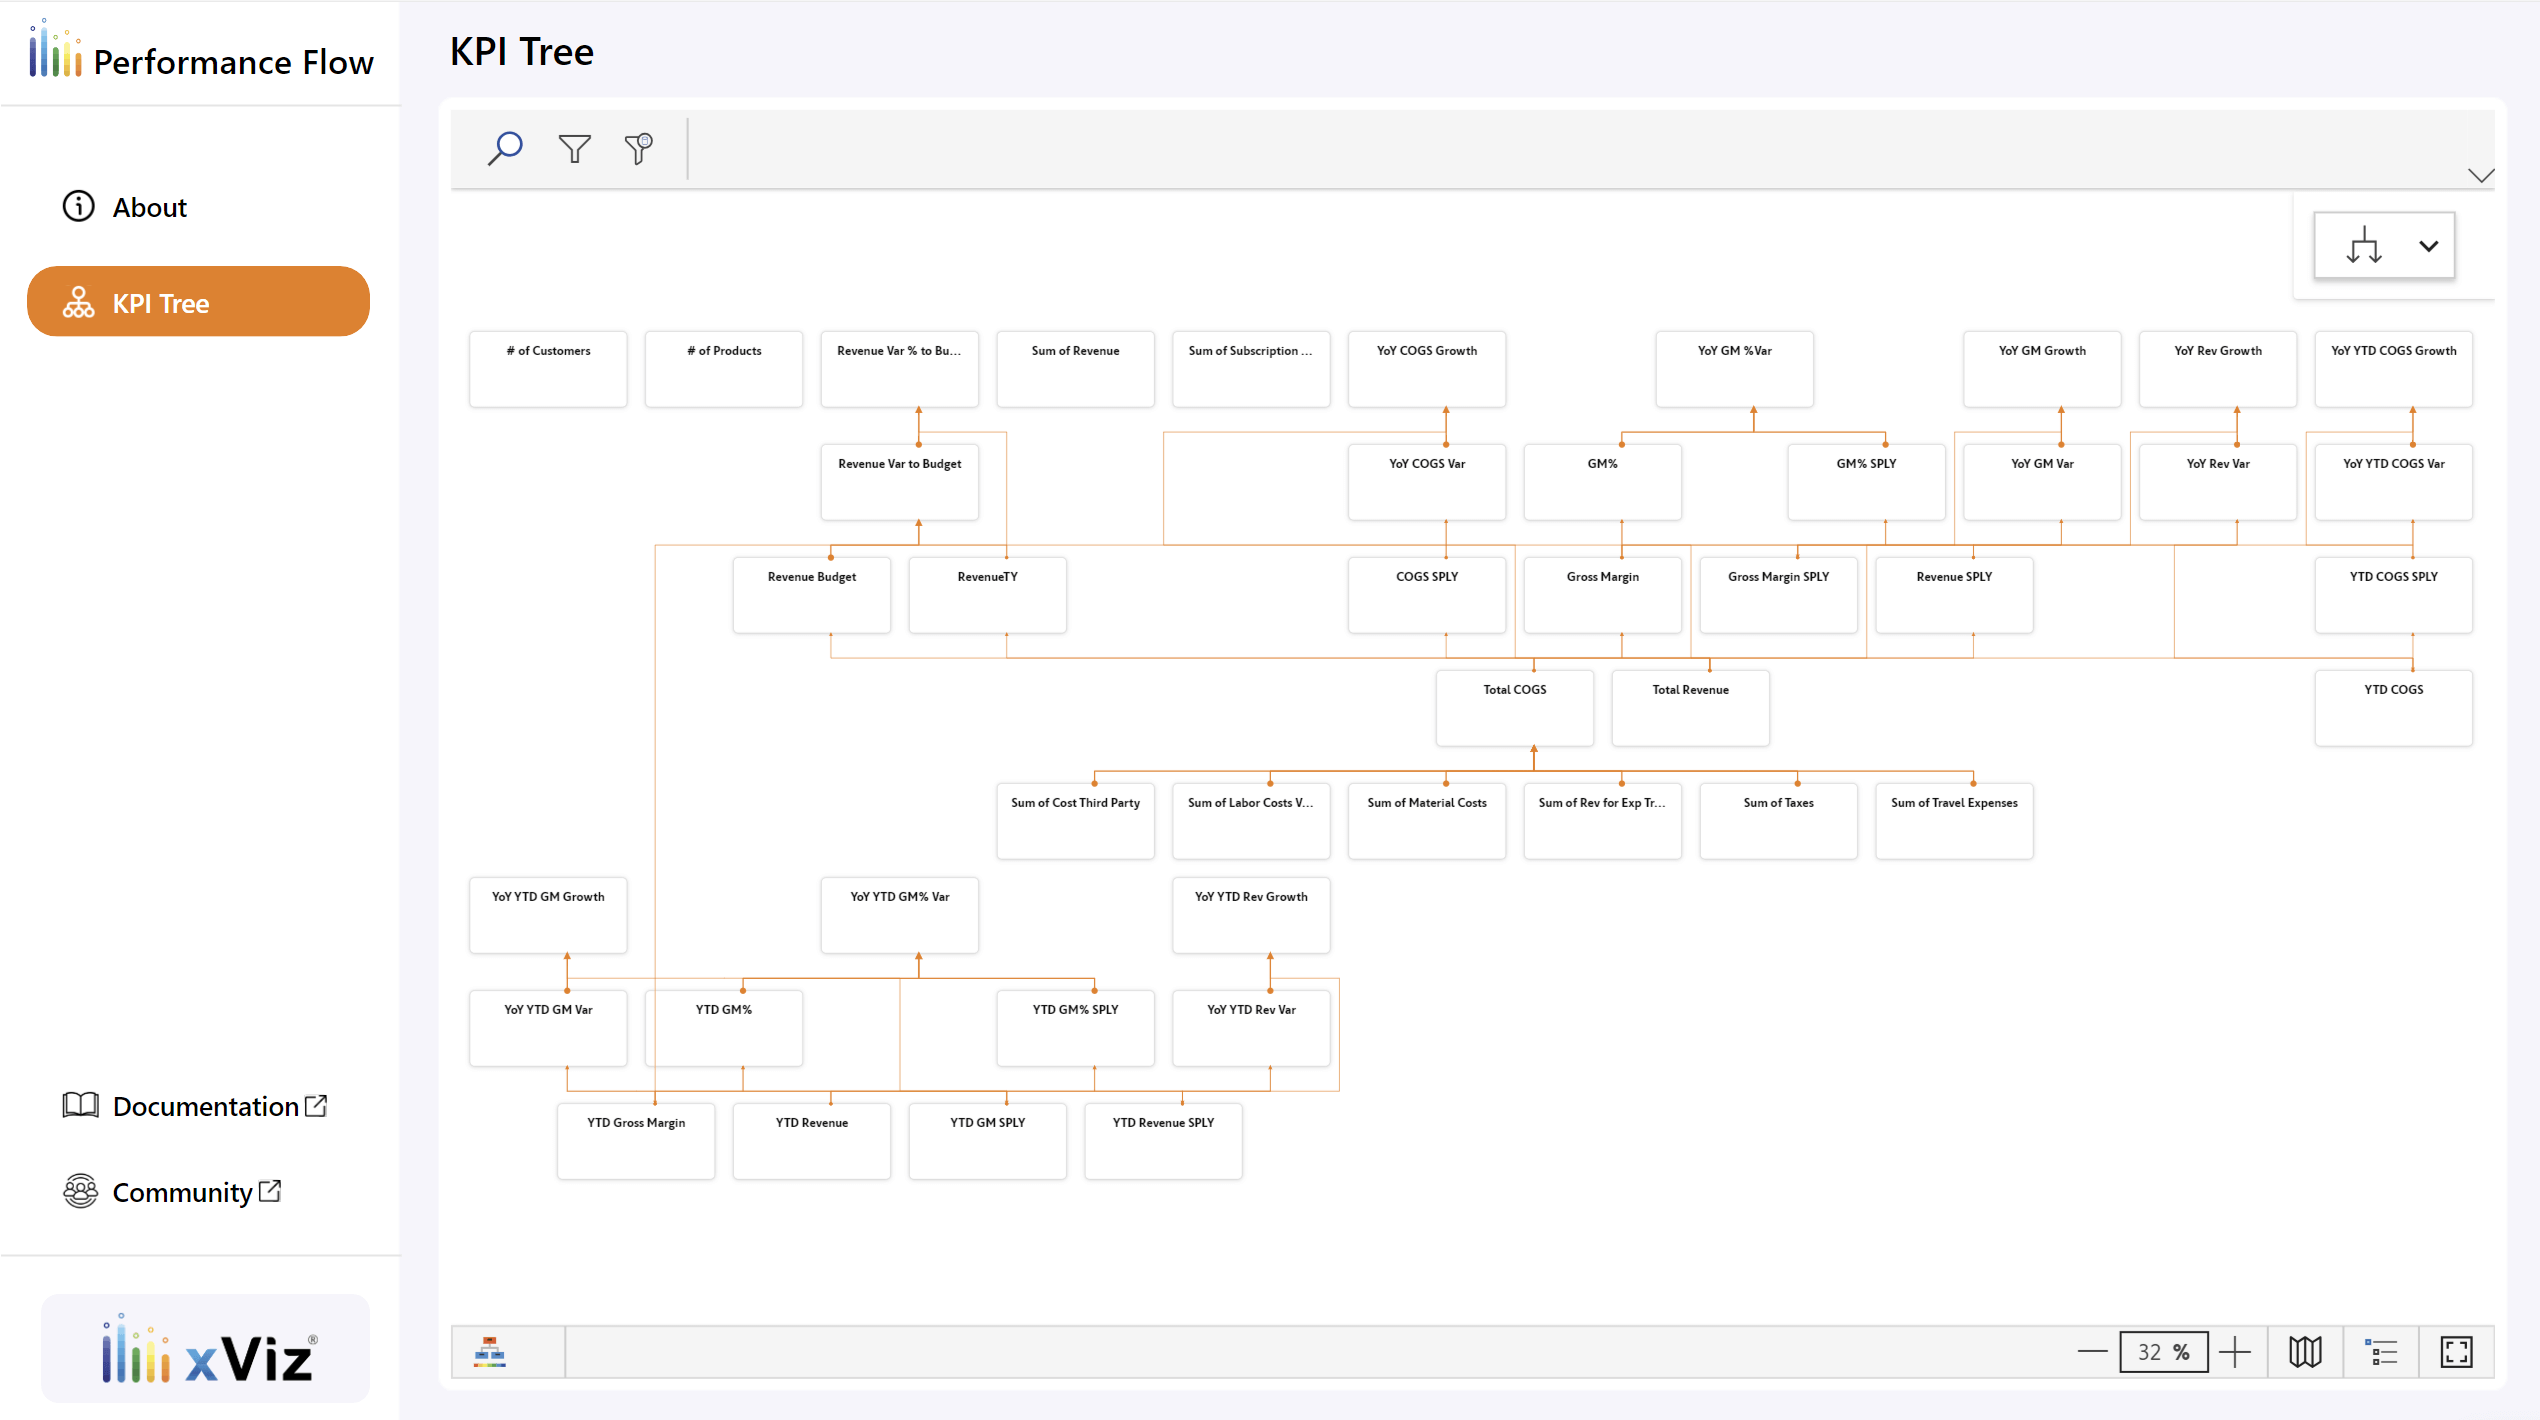
Experience the power of data visualization with our KPI Tree dashboard, brought to life using the new Power BI INFO functions! This dynamic tool transforms complex measure dependencies into clear, intuitive visuals, enabling you to make informed decisions quickly.
With just a few transformations, xViz Performance Flow helps you uncover insights and relationships within your data. Plus, you can visualize other INFO functions just as seamlessly, ensuring you never miss a critical connection.

Headquarters
5920 Windhaven Pkwy
Plano TX 75093