Free 30-Days trial for xViz visuals here!

Performance Management

Performance flowNew

xViz Performance Flow

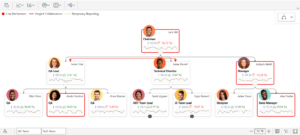
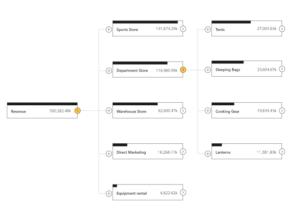
Enable faster decision-making with the big-picture view using the xViz Performance Flow visual. Gain insights into People, Places, and Entities with Performance Indicators, Trendlines, and Advanced Alerting. Perform effortless visual exploration and analysis with dynamic interactivity.

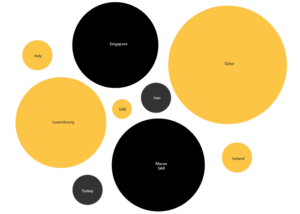
Unleash the potential of visualizing your:

  • Organization Chart
  • Process Flow / Swim Lanes
  • Cost Center/Financial Performance Analysis
  • Sales Performance Analysis
Explore Performance Flow

Project Management

Gantt chart

xViz Gantt Chart

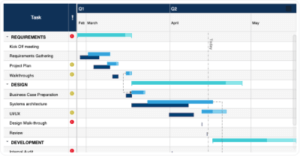
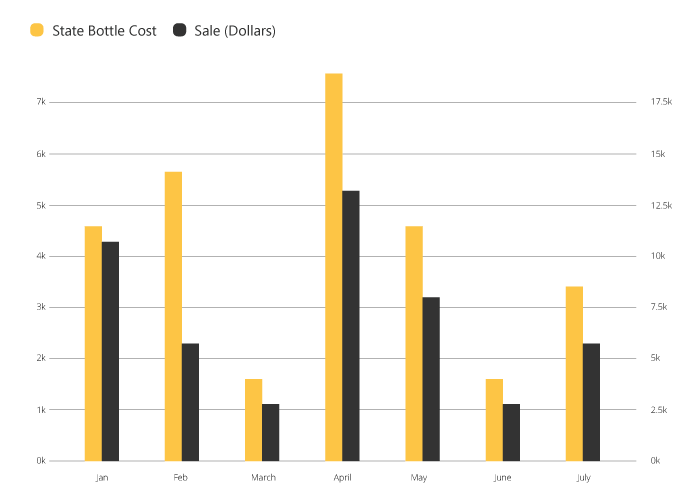
Ease your Project Management in Power BI and make smart decisions with the xViz Gantt chart. It provides robust functionalities such as:

  • Conditional Formatting
  • Multiple Reference Lines
  • Live Editing on the fly
  • Runtime Zoom & more!
Explore Gantt Chart

Get xViz Advanced Visualization Brochure

Get your powerful, intuitive, and customizable xViz data visualization brochure now.
Download now
xViz
About xViz!
xViz is a leading provider of advanced enterprise-grade visuals for Microsoft Power BI. The powerful, intuitive, and customizable data visualization experience of xViz, maximizes the potential of the data and elevates analysis to new heights. This product is developed by Lumel Technologies (formerly Visual BI), which has a decade of experience in building add-on solutions on top of BI platforms (SAP BI and Power BI) with our suite of innovative products such as Inforiver, xViz and ValQ.
PBI Certified

Headquarters

5920 Windhaven Pkwy, #130
Plano TX 75093

Inforiver
ValQ
cross linkedin facebook pinterest youtube rss twitter instagram facebook-blank rss-blank linkedin-blank pinterest youtube twitter instagram