


| Features | xViz Packed Bubble FREE | xViz Packed Bubble PRO |
|---|---|---|
| Data Label Styling Options | ||
| Text Scaling | ||
| Advanced Conditional Formatting | ||
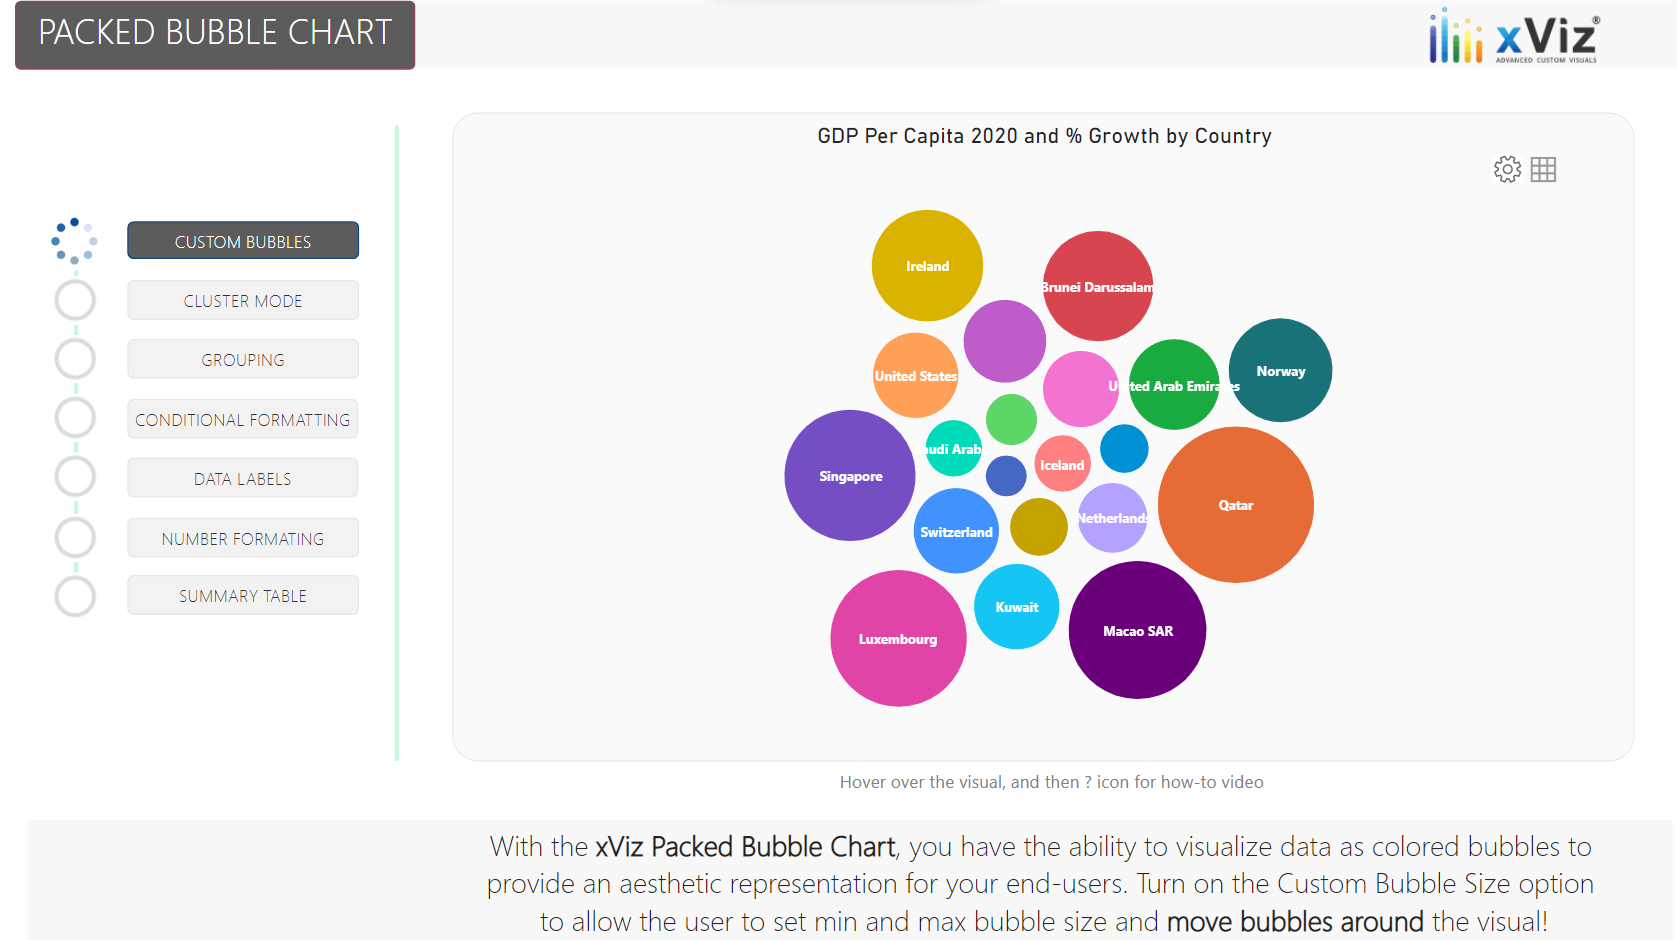
| Customize Bubble Size | ||
| Number formatting | ||
| Custom API | ||
| Custom CSS | ||
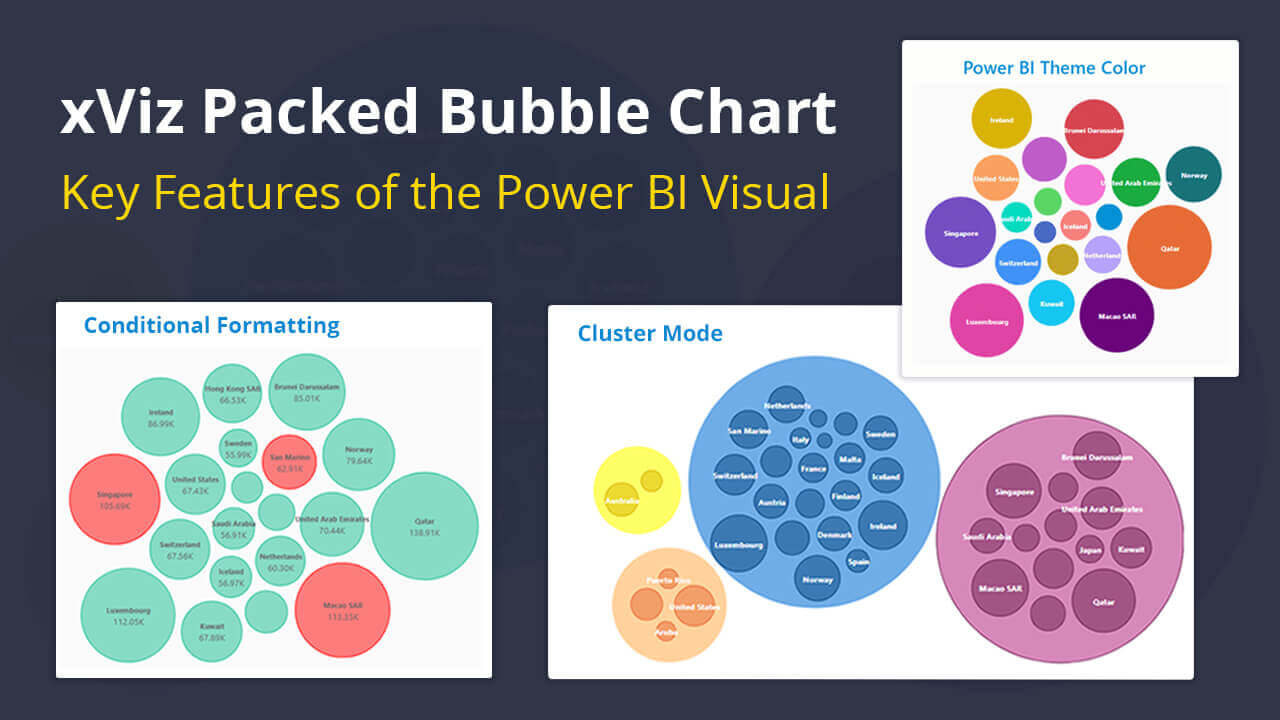
| Cluster Mode | ||
| Grouping Mode | ||
| Conditional Formatting in Legends | ||
| Semantic Formatting | ||
| Summary Table | ||
| Global Font Family | ||
| Utility Menu - Exporting Options | ||
| Footer Section | ||
| Get IT FREE | Buy IT |

Headquarters
5920 Windhaven Pkwy
Plano TX 75093