*Our xViz FREE Desktop Edition has been recently prompting users to upgrade to a paid subscription. This error is due to a Power BI update. We regret the inconvenience caused.
While we are working on fixing the issue as a priority,


| Features | Power BI Waterfall Chart | xViz Waterfall Chart Features Free | xViz Waterfall Chart Features PRO |
|---|---|---|---|
| Orientation | |||
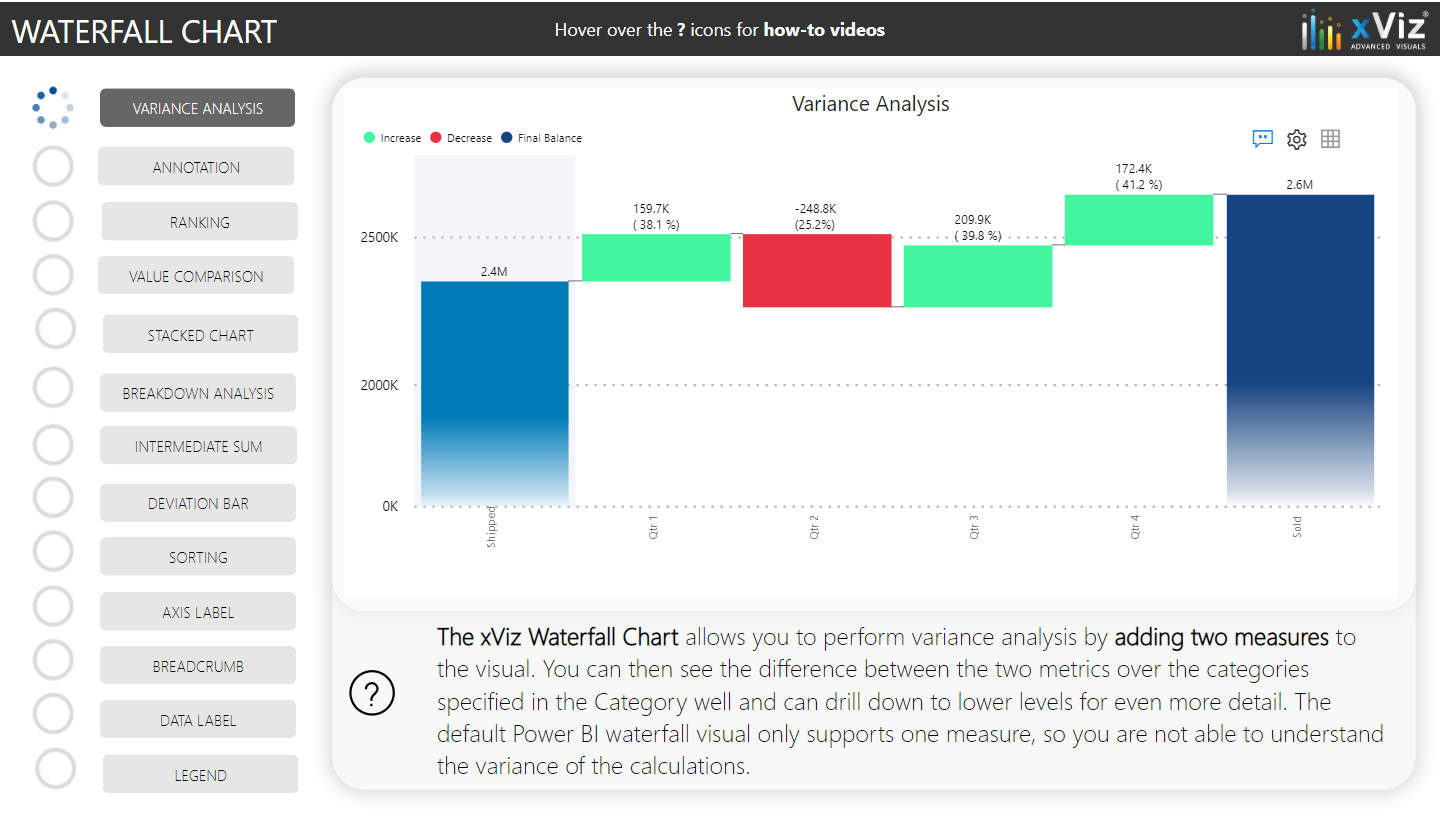
| Variance Analysis Scenario | |||
| Breakdown Scenario - Simple | |||
| Breakdown Scenario - Running Sum | |||
| Intermediate Sum | |||
| Breadcrumb Display | |||
| Number formatting | |||
| Axis Break | |||
| Runtime deviation Bar | |||
| Enable/ Rename Final Balance | |||
| Custom Sort (Var and Var %) | |||
| Context Menu | |||
| No of data series displayed | |||
| Reverse Axis | |||
| Label Orientation | |||
| Coloring options | |||
| Summary Table with advance features | |||
| Line Styling | |||
| Global font family | |||
| Utility Menu - Exporting Options | |||
| Footer section | |||
| X and Y Axis positioning | |||
| Axis Label customization | |||
| On Demand Drilldown | |||
| Sorting | |||
| Get IT FREE | Buy IT |

Headquarters
5920 Windhaven Pkwy
Plano TX 75093