Timelines are the most important component in a Gannt Chart because they show you the essential chronological context for tasks and projects; They tell you when tasks start and how long they will take.
The ability to adjust and customize these timelines while interacting with the Gantt Chart gives users a valuable opportunity to scrutinize and assess the project plan in alignment with their specific preferences and requirements.
Our xViz Gannt Chart gives you a robust suite of tools and configurations to visualize your timelines within Power BI:
Multi-level Timeline:
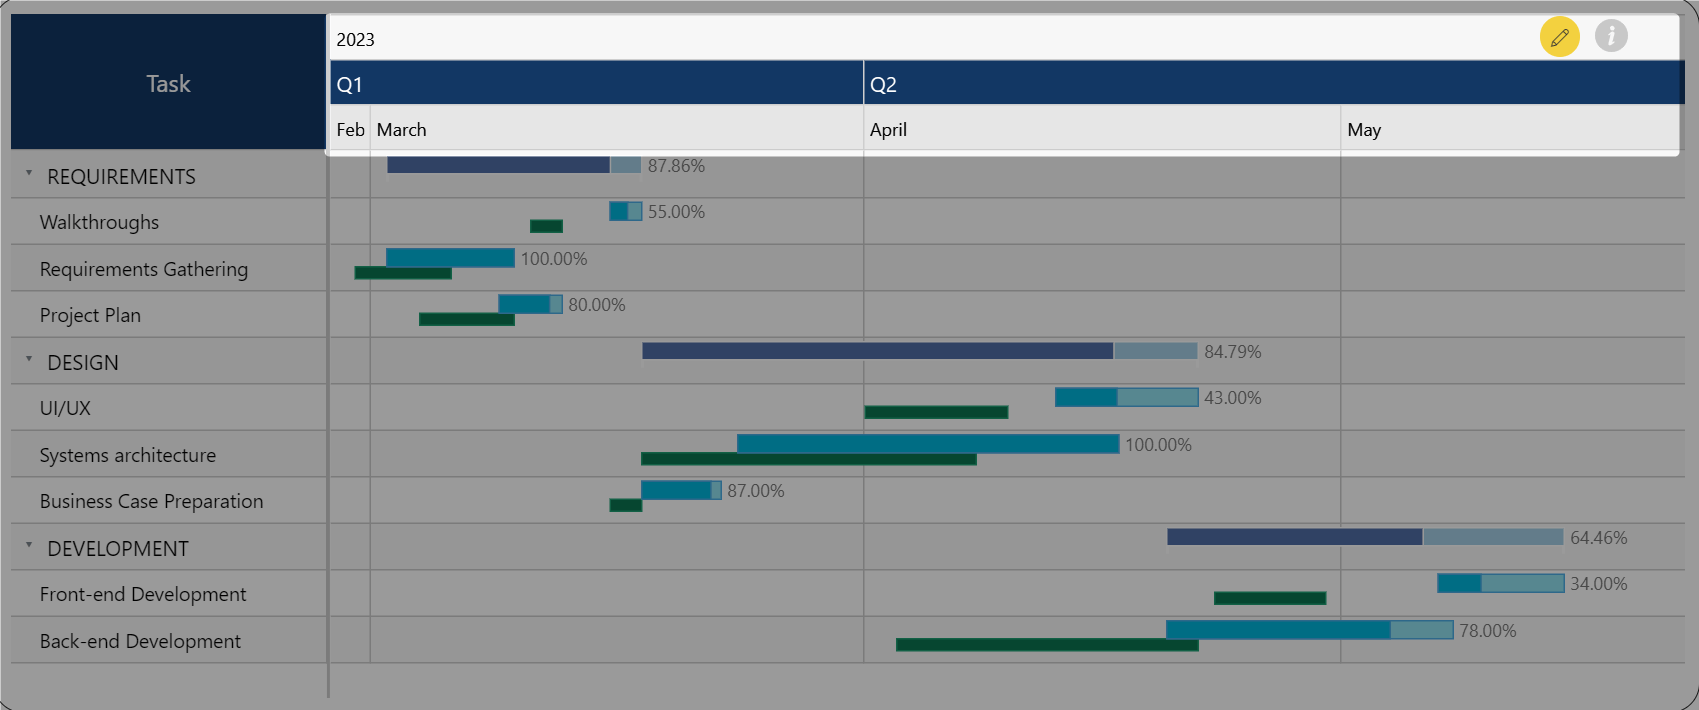
The xViz Gantt Chart offers the capability to incorporate up to three distinct levels within the timeline, thereby enhancing the provision of additional date and time context while maintaining a clutter-free timeline view.
Different end users often have different viewing perspectives and would like to look at the timeline on different date/time units. For instance, a development manager would be interested in looking at the timeline in terms of weeks. While the construction contractor would be interested in tracking the timeline at the day level.

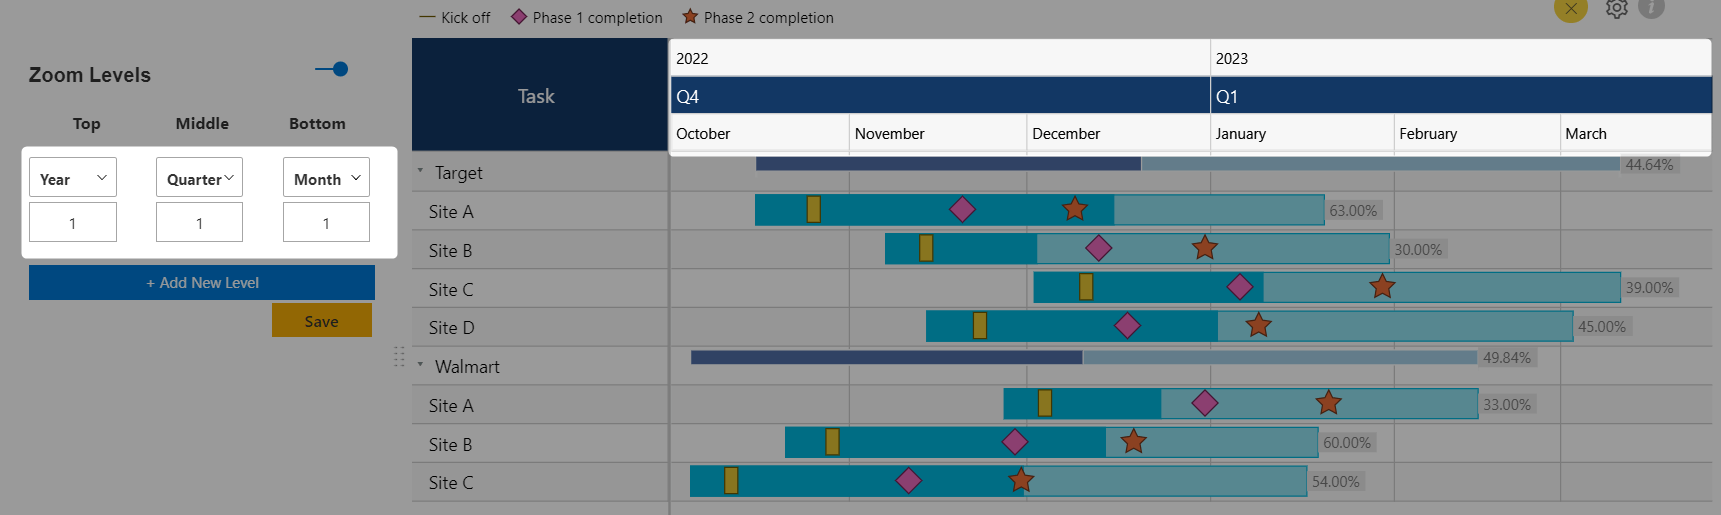
In the above example, the timeline is shown in three levels – Year, Quarter, Month. With multiple levels, the view provides multiple contexts but with a clean view.
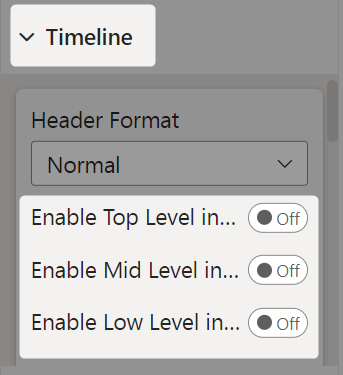
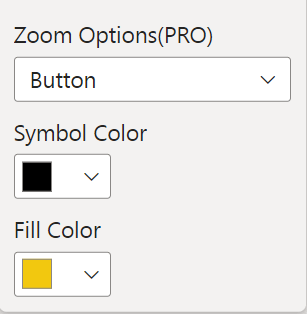
Each zoom level can be easily toggled on/off in the visual format pane settings:
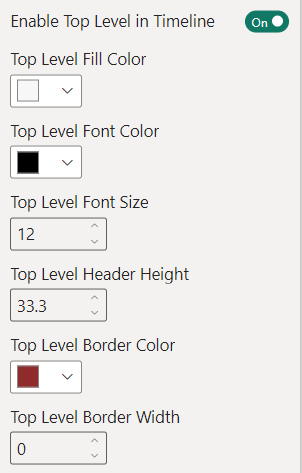
Additionally, the visual provides a range of formatting options to tailor the appearance and style of each timeline level:
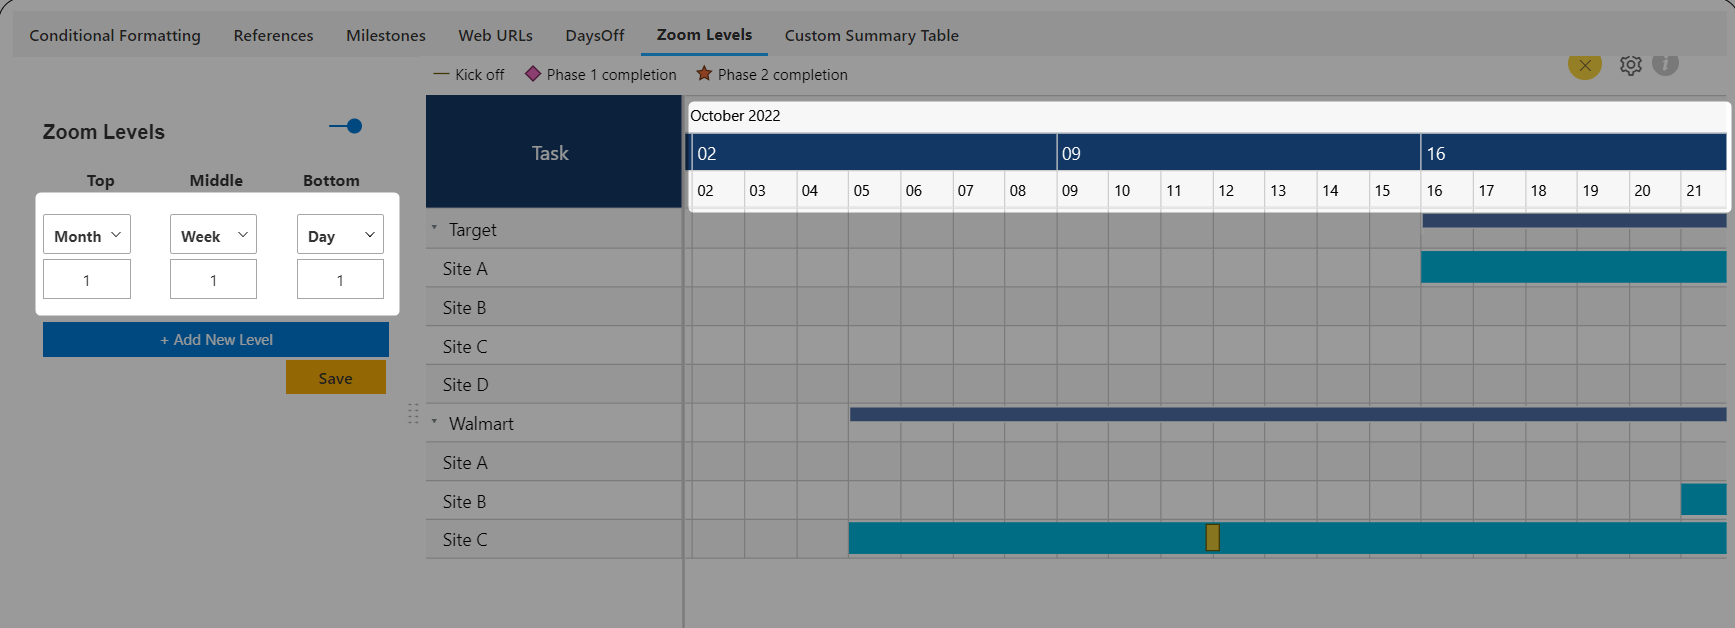
Zoom Levels Configuration:
It is important to define the levels of the timeline. In addition, providing users with the ability to switch to deeper levels gives great flexibility. The same view can cater to a broader audience when different time unit perspectives can be provided.
Configure the zoom levels by specifying the date/time unit to be displayed at each level, utilizing the Zoom Levels settings accessible through the Advanced Editor. Additionally, you can define skip numbers for the respective units to fine-tune the level of detail.
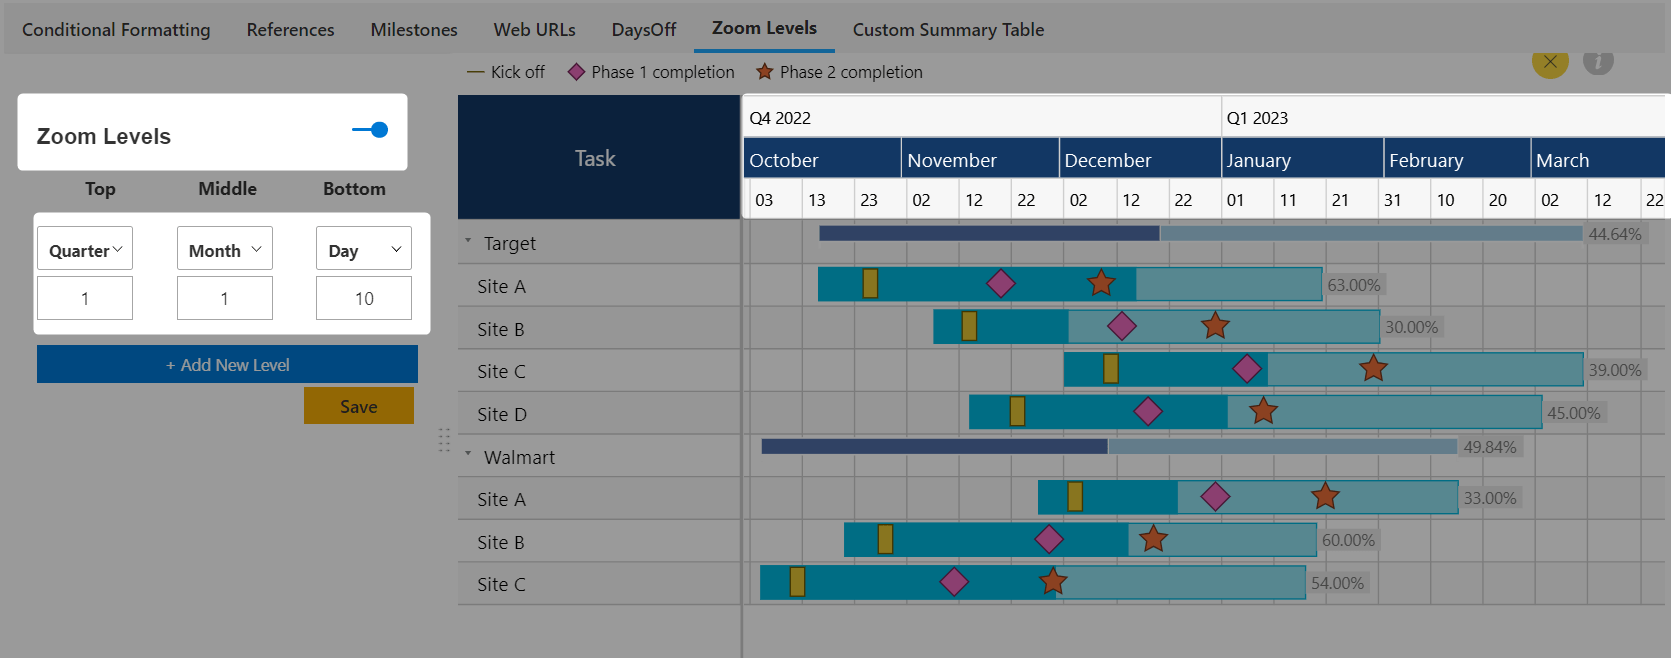
In the above example, the three levels are configured as Quarter -> Month -> Day. Notably, the skip numbers are set to Quarter = 1, Month =1, and Day = 10. This configuration results in the display of every quarter and every month, while only every 10th day is presented on the timeline.
Similarly, we can have different configurations as per the requirement:
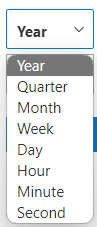
xViz Gantt Chart provides 8 options of Timeline units to configure for the timeline levels:
Zooming Capabilities:
Enable report consumers with the capability to zoom into the timeline effortlessly, either by utilizing the mouse wheel or the visual's built-in zoom navigation controls. Zooming functions to stretch the timeline, providing a finer-grained perspective of the data.
Continuing to zoom in triggers an automatic adjustment of the timeline levels in accordance with the predefined settings outlined in the Zoom Levels configuration.
In the provided example, the initial configuration sets the levels to Year -> Quarter -> Month. Upon further zooming in, the levels transition to Month -> Day -> Hour, and with even more granularity, they progress to Day -> Hour -> Minute, accommodating the user's need for varying levels of temporal detail.
Zoom Range Setting:
Configure the zoom range setting to specify the span of the timeline that should be visible at any given moment.
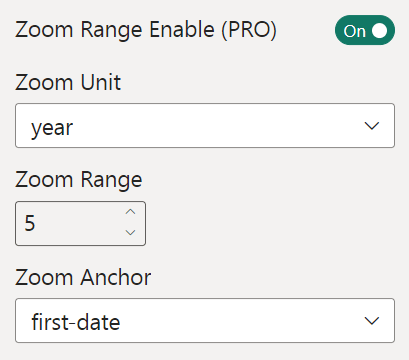
In the provided example, the timeline is set to display a 5-year period. If the timeline encompasses more years beyond this range, a horizontal scroll feature is introduced, allowing users to navigate to the remaining timeline data.
The default position of the scroll is determined by the “Zoom Anchor” option.
In conclusion, the remarkable flexibility offered by the xViz Gantt Chart's timeline configuration simplifies the process of visualizing tasks and projects across various timeline units. The inclusion of zooming options enhances interactivity, giving report consumers the freedom to seamlessly visualize the timeline at varying levels of granularity. This combination of adaptability and user-friendliness empowers users to gain deeper insights and make more informed decisions when working with projects and tasks in Power BI.
Try the xViz Gantt Chart (Microsoft certified) for Power BI from Microsoft AppSource here.