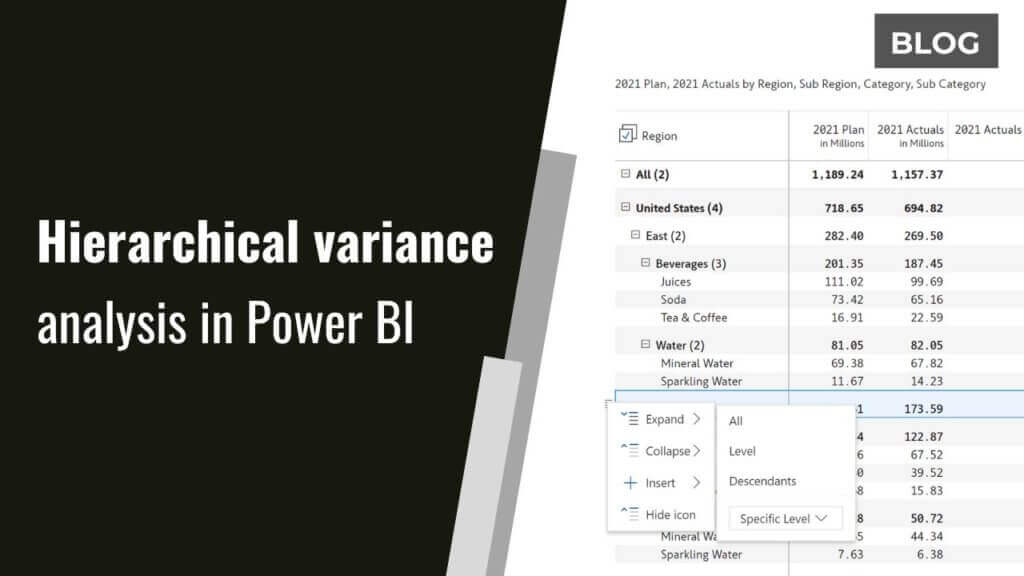
Free 30-Days trial for xViz visuals here!

Hierarchy Variance Table [Deprecated]

Power BI Certified xViz Visual
xViz Hierarchy Variance Table has been deprecated, but we have something even better to meet your needs.

Explore our new Inforiver Matrix visual – that provides the user with the ability to view and analyze hierarchical data with much more detailing added to it. The extensive list of features lets you consume business trends, hierarchies, and different forms of data all at once and view it in a much appealing visual form. The inbuilt arithmetic capabilities of this table provide the absolute and relative variances to previous year and plan using three table templates.

Key Features

Conditional formatting

Conditional Formatting

% Variance Based on Conditional Formatting is applied to each member by default
Breadcrumb

Expand/Collapse-enabled hierarchical table

Without the need to drill-down, you can view all the levels of data at once on the Hierarchical Variance table.
Styling Feature Pie

Track Absolute and % Variance

The table calculates the Absolute Variance, % Variance at every level of the hierarchy irrespective of the level.
Various chart types

Display Sparkline

When Time Period is added to Hierarchical Variance Table, a sparkline appears beside every value
Search

Search, Filter, Find, Seek

Advanced Search Option in the Hierarchical Variance Table lets you search and filter important specific data
Display settings

Semantic Formatting

This feature enables you to visually differentiate positive and negative values based on your enterprise needs.

What do I get in the PRO version?

Features Power BI GaugexViz Advanced Gauge FreexViz Advanced Gauge Pro
Chart Type - Full circle and Arc
Adv Conditional Formatting - Track background
Marker Customization
Number Formatting
Semantic Formatting
Gauge width and positioning
Single Axis / Dual Axis
Data Label Customization
Needle display
Reverse Axis
Axis Label Customization
Global font family
Utility Menu - Exporting Options
Chart Type - Semi Circle
Footer section
Context Menu
Get IT FREEBuy It
– Not Available – Available in Desktop – Available in Desktop & Service

Want to explore other visuals?

Get xViz Advanced Visualization Brochure

Get your powerful, intuitive, and customizable xViz data visualization brochure now.
Download now
xViz
About xViz!
xViz is a leading provider of advanced enterprise-grade visuals for Microsoft Power BI. The powerful, intuitive, and customizable data visualization experience of xViz, maximizes the potential of the data and elevates analysis to new heights. This product is developed by Lumel Technologies (formerly Visual BI), which has a decade of experience in building add-on solutions on top of BI platforms (SAP BI and Power BI) with our suite of innovative products such as Inforiver, xViz and ValQ.
PBI Certified

Headquarters

5920 Windhaven Pkwy, #130
Plano TX 75093

Inforiver
ValQ
cross linkedin facebook pinterest youtube rss twitter instagram facebook-blank rss-blank linkedin-blank pinterest youtube twitter instagram