Free 30-Days trial for xViz visuals here!
#1

Project Management - Gantt Chart

Power BI Certified xViz Visual
xViz Gantt Chart is the most preferred gantt for large enterprises world-wide. From visualizing Alerts to customizable Timeline, from Dependencies tracking to Reference Lines/Ranges, xViz Gantt Chart provides unmatched capabilities. 
Join the ranks of leading organizations and elevate your project management insights!

The Gantt Chart for Power BI shows activities (tasks or events) displayed along a given timeline. On the left side of the chart is the Data Grid, which displays lists all the tasks as part of the project or work breakdown the structure to be completed. It is one of the most widely used project planning tools. It helps you visualize your project plan to articulate, communicate, and monitor the progress.
Trusted by Enterprises Worldwide

gantt-chart-customer-portfolio

Customer Success Story

Leading COVID-19 Vaccine Manufacturer, Novavax Inc. uses xViz Gantt Enterprise to streamline Project Management

As a leading vaccine developer in the market, Novavax Inc. looked towards improving their reporting and dashboards that involve project scheduling and planning
For any feature requests or questions about this advanced custom visual, please write to us at community.xviz.com
View interactive content

Key Features

Gantt basics

Gantt Basics

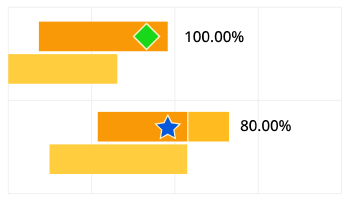
Baseline bars, Progress, Different Milestones
Connectors

Connectors

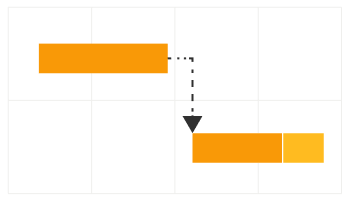
Define customizable connector lines to visualize dependencies
Multi-level timeline

Multi-level Timeline

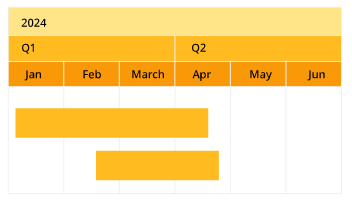
Display timelines at multiple levels for detailed project tracking
Timeline zooming

Timeline Zooming

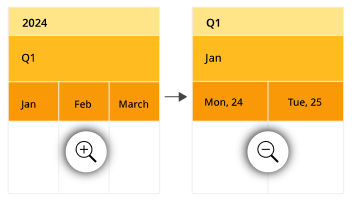
Leverage data-driven rules to highlight outliers, top performers, and bottom performers through node border, background, or font color for swift decision-making
Conditional formatting

Conditional Formatting

Offer additional textual context through annotations, elevating the narrative and insights
Reference line

Reference Lines/Ranges

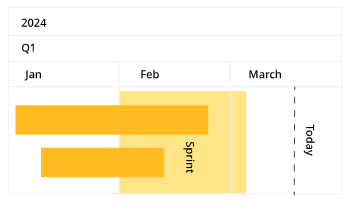
Incorporate horizontal lines or ranges to indicate dynamic today line, sprints, key deadlines etc.

Resources

xViz Performance flow
Video
xViz Performance Flow
Designed to enhance your decision-making process by providing a comprehensive overview of your data.
Watch it
Blog
xViz Performance Flow Featured as Editor's Pick in Power BI Summary August 2024 
We’re thrilled to share that xViz Performance Flow has been featured as the Editor’s Pick…
Read More...
Webinar On-Demand
This is a block of text.
This is a block of text. Double-click this text to edit it.
Watch it
Blog
Top 5 Exciting New Features in the xViz Gantt Chart for Power BI
Based on our customers’ feedback, we are proud to introduce this host of feature updates…
Read More...
Webinar On-Demand
This is a block of text.
This is a block of text. Double-click this text to edit it.
Watch it
More blogs
basics-gantt-chart-documentation
Documentation
Getting Started
Technical Documentation to help you set up xViz Gantt chart in your reports
Read more
Webinar
Tackling common Project scenarios using Gantt Chart in Power BI [Webinar On-Demand]
In this on-demand webinar, we provide a cursory introduction to the Gantt Chart Enterprise and…
Read More...
Read more
Gantt Enterprise
Video
xViz Gantt chart - Hierarchy creation
Use advanced enterprise level capabilities to show how project breaks down into tasks, subtasks, and track project milestones and more.
Watch it
More videos
Blog
xViz Performance Flow Featured as Editor's Pick in Power BI Summary August 2024 
We’re thrilled to share that xViz Performance Flow has been featured as the Editor’s Pick…
Read More...
Read more about Performance Flow

What do I get in the PRO version?

Features Power BI Gantt ChartxViz Gantt Chart Free xViz Gantt Chart EnterpriseSold separately and is not part of the xViz Pro Suite
Conditional Formatting -Progress Bar, Status Flag, Data GridUnlimited Rules for Alerting can be Added
Live Editing
Additional Chart Options - Gantt Resource
Fiscal Year
Zoom Options - Runtime and Design TimeBoth Runtime and Design Time Options Available
Reference LineUnlimited Reference Lines can be Added
Number Formatting
Milestone Customization - Shape and Color
Display Totals
Filter Blanks
Root Node Styling
Web URLs
Timeline Zoom
Advanced Editor - Zoom Levels
Export to Table
Progress Bar display - Bar/Bullet
Additional Columns (Categories and Value)
Data Grid Customization
Parent Node Customization
Timeline Customization
Define Different Timeline Levels
Data Label Customization
Data Label based on field
Summary Table
Color Customization based on Different Rules
Alternate row color
Hover color
Connector Lines
Legends for Milestone
Display Milestone in Parent Node
Global Font Family
Today's Date Reference Line and Text
Get IT FREEBuy IT
– Not Available – Available in Desktop – Available in Desktop & Service

Get xViz Gantt Chart Brochure

Discover why xViz Gantt is #1 and why top enterprises choose xViz in this brochure.
Download now
xViz
About xViz!
xViz is a leading provider of advanced enterprise-grade visuals for Microsoft Power BI. The powerful, intuitive, and customizable data visualization experience of xViz, maximizes the potential of the data and elevates analysis to new heights. This product is developed by Lumel Technologies (formerly Visual BI), which has a decade of experience in building add-on solutions on top of BI platforms (SAP BI and Power BI) with our suite of innovative products such as Inforiver, xViz and ValQ.
PBI Certified

Headquarters

5920 Windhaven Pkwy
Plano TX 75093

cross linkedin facebook pinterest youtube rss twitter instagram facebook-blank rss-blank linkedin-blank pinterest youtube twitter instagram