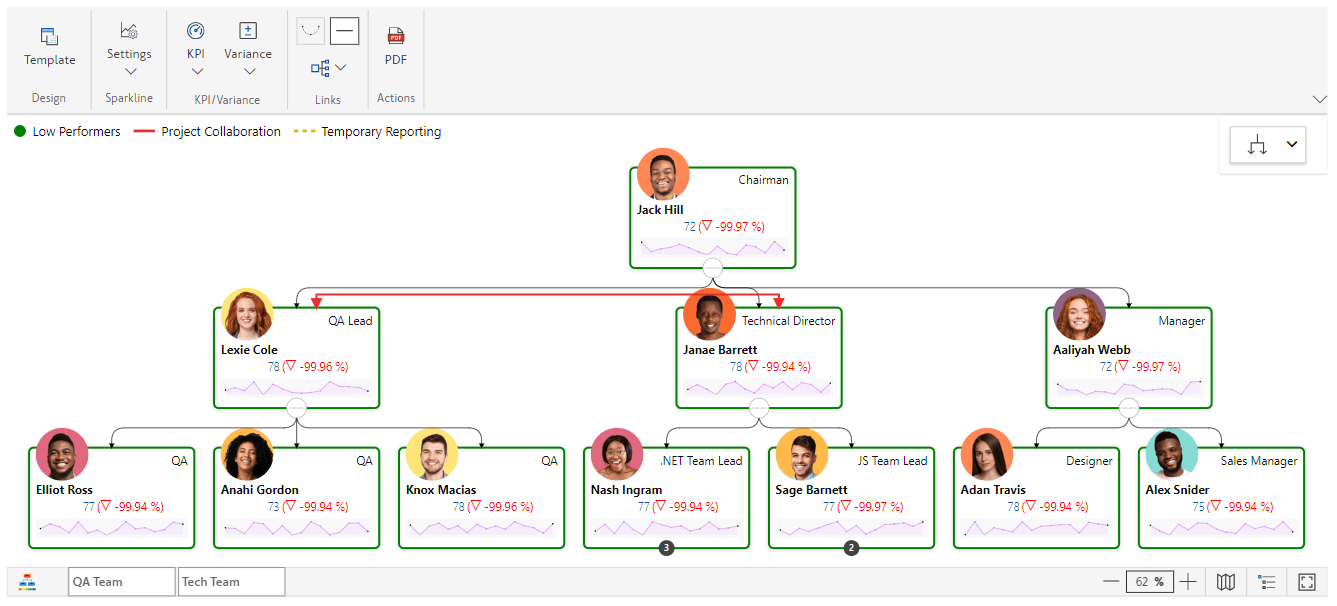
xViz Performance Flow is a graphical representation of performance for hierarchical structures. It allows you to visualize the performance across different levels in the hierarchy and shows you how it builds up at the top of the hierarchical structure or how it is distributed in lower levels of the structure.
xViz Performance Flow visual in combination with Power BI drill through allows you to access more detailed information for specific data cards within the Performance Flow view, enhancing your data exploration capabilities.
For example: Consider a scenario where the Chairman of the Company desires a detailed analysis of a specific team. This involves focusing on the manager's details and individual team members. By using drill-through, you can get a detailed report on the manager and the team members by simply right-clicking on the manager’s card.
Use Cases of Drill Through in Performance Flow:
- Focus on Specific Data Points or Cards: Dive in finer details of specific data points.
- Contextual Exploration: Get a better understanding of your data's context by drilling through related information.
- Interactive Dashboard: Create dynamic and interactive dashboards that respond to user queries and exploration.
Setting up a Drill-Through Page
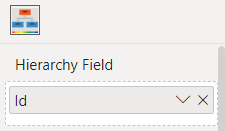
Note: The Drill-through feature in the Performance Flow visual gets applied to the fields inserted in the “Hierarchy Field” section in the Data Pane
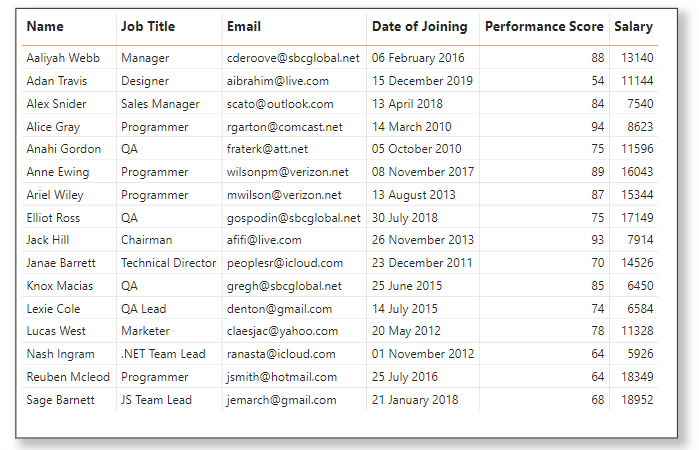
Step 1: Create a detailed page containing the required information about team members and their respective managers. We presented data in a tabular format for ease; however, you can feel free to use other visualizations for design flexibility.
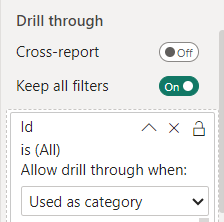
Step 2: Once the visual page is ready , navigate to the “Drill through” section of the Visualizations pane and drag the field for which you want to enable drill-through into the "Drill through" well.
Include the ID column in the Drill-through section filter of the detailed page. And set the “ID” column setting as “Used as Category”.
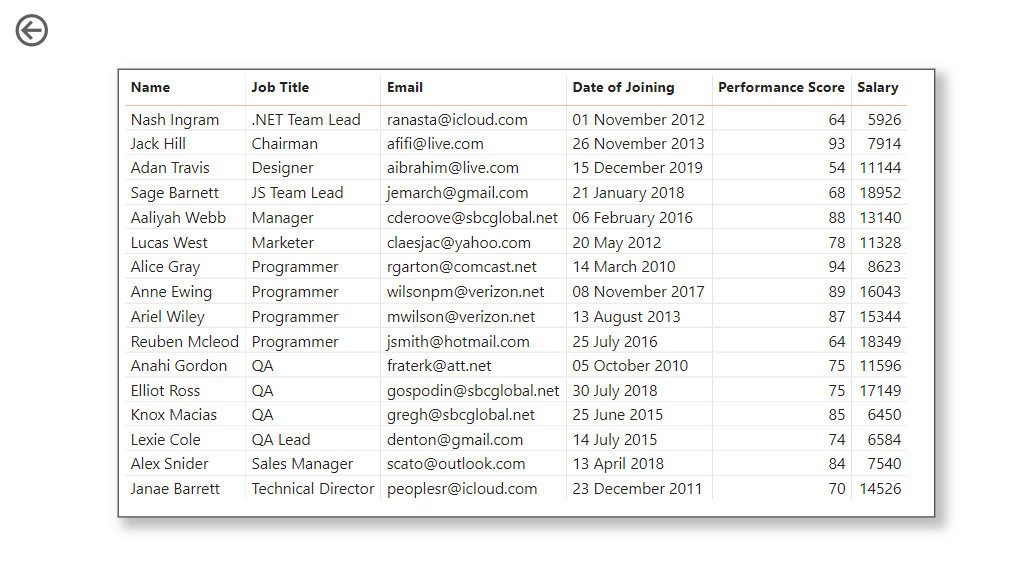
This action automatically creates a back button on the respective page, enabling you to effortlessly return to the previous report page.
When you want to navigate to the detailed page from the Chart page, right-click on the card, and from the context menu select the “Drill-Through” option. This action redirects you to the corresponding detailed page, providing a way to explore additional information.
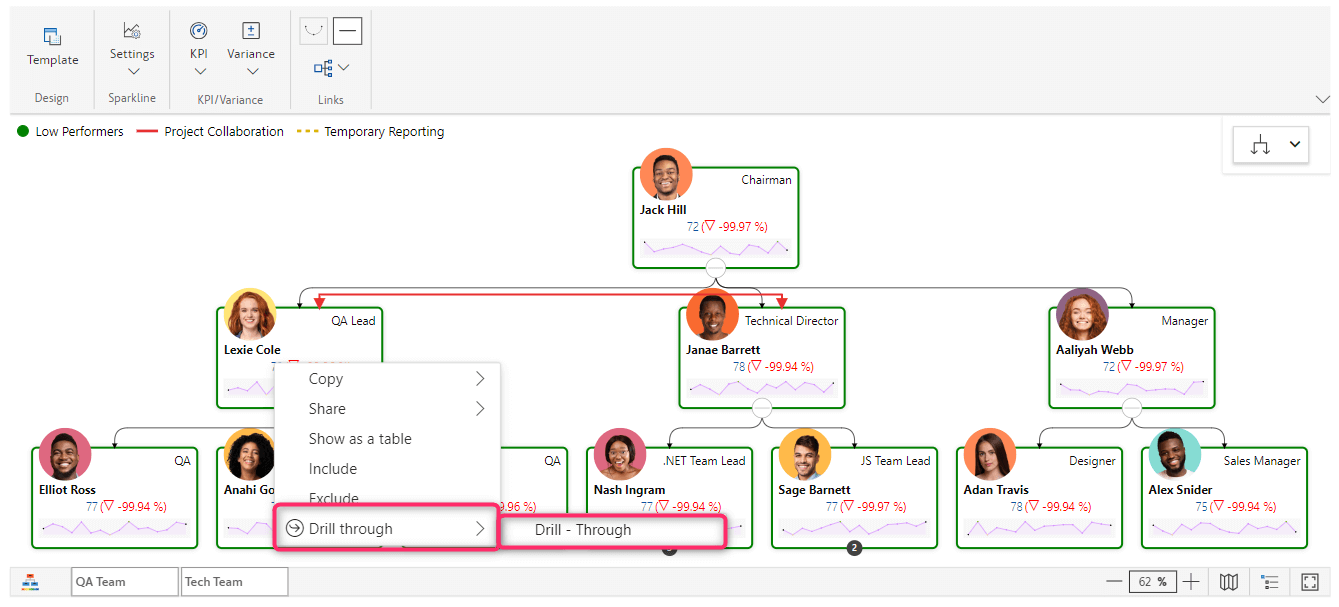
In the image above, the Chairman aims to view comprehensive information about the QA Lead. To achieve this, select the QA Lead Card, right-click on the card, and then choose the Drill Through option.
In the above GIF, Drill-through in Performance Flow presents an interactive feature that allows the Chairman to explore the data of any team member by simply hovering over and clicking on individual members’ cards.
The drill-through functionality enables a thorough exploration into specific individual data, providing a comprehensive hierarchical view that enhances visual interactivity and appeal in Power by integrating analytical insight.
Explore the different functionalities of the xViz Performance Flow (Microsoft Certified) from Microsoft AppSource here.