This blog is part of the Multi Axes Blog Series
In this blog, we will see how to pass dynamic values to an external Drilldown Report (SAP Webi) from Power BI using External URL feature from xViz Multi Axes Chart. xViz Visuals has made our analytics life easier by providing many useful features that easily integrate with Power BI dashboarding norms. Often, we might need a detailed report to be analyzed on-demand basis based on the parameters selected.
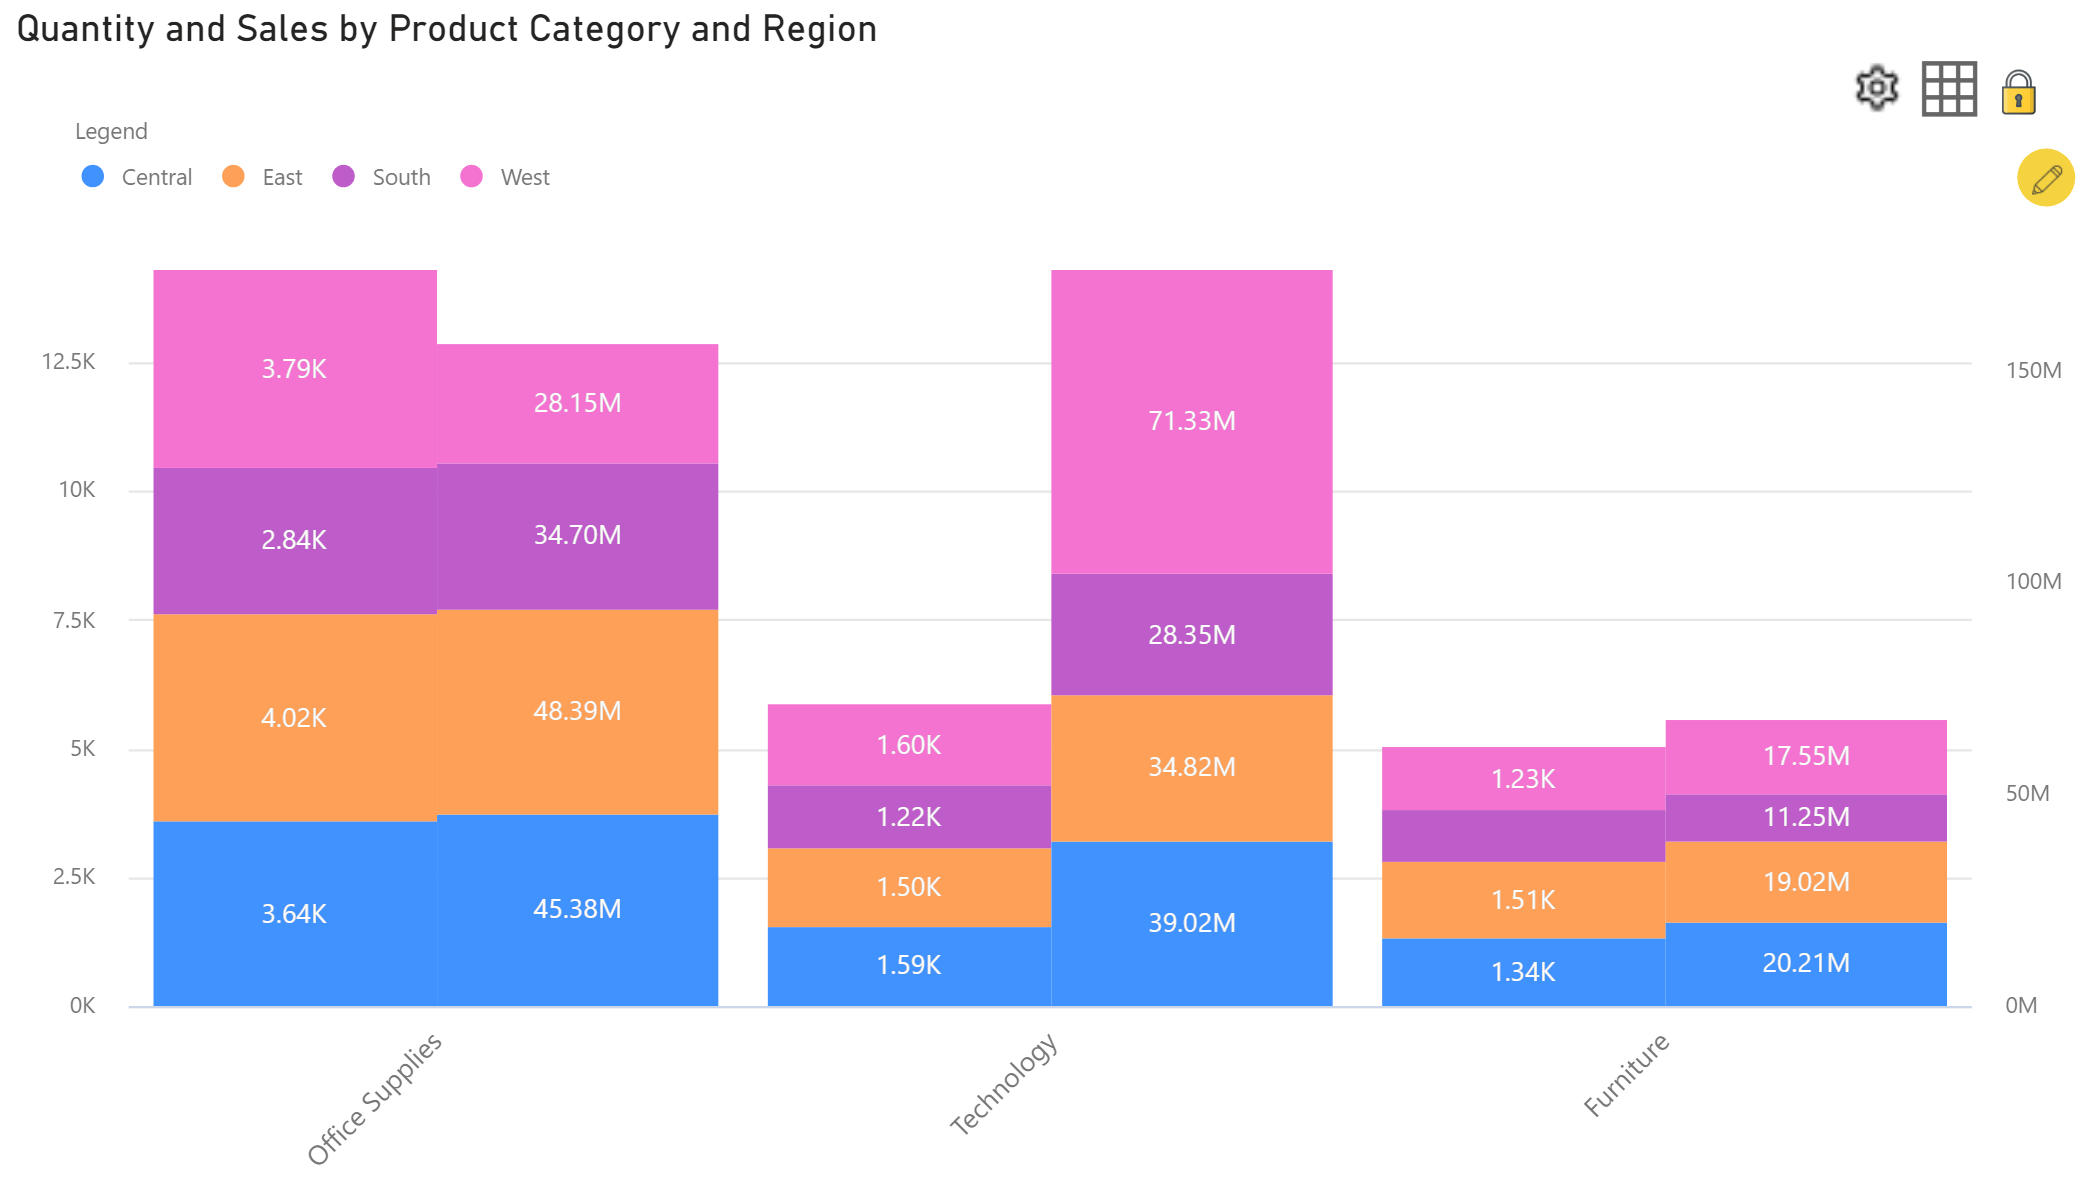
In the below example, we have ‘Quantity Sold’ & ‘Sales’ by Product Category & Region shown in an xViz Multiple Axes Chart & would like to drill down further to see the products that are being sold by the state in a detailed Webi report
“External URL” feature comes with three parts, URL to provide the Open-doc link of the drill-down report, Key to type in the name of the parameter and Value to assign value to the parameter based on 5 different contexts,
- Value – to pass the datapoint value e.g. 17456.4
- X-axis – axis field value based on selection e.g. Technology, Furniture, etc.
- Series Legend – Legend value based on the color selected e.g. east, west, etc.
- Tooltip Index – to pass the information which is not present in the axes but added to the tooltip
- Custom – some additional parameters which are part of the link e.g. format, language
Webi Prerequisites
To pass filter values from Power BI to a drill-down Webi report, the dimensions for which parameter values need to be passed is needed to be created as prompts in the Webi report. Parameters can be passed by appending ‘&’ to the report’s OpenDoc link which is managed by xViz visual internally.
OpenDocument Syntax
An OpenDocument URL is generally structured as seen below:
| Document Link | https://<ServerName>:<Port>/OpenDocument/opendoc/penDocument.jsp?sIDType=CUID&iDocID=AtcPeVd0wMRLo.xxK9TJ6JE |
| lsS[Name] | To pass single value prompt |
In our example, we have created the below two Webi prompts each for ‘Product Category’ & ‘Region’ dimensions:
| XPRODCAT | Prompt for Product Category Dimension |
| XREGION | Prompt for Region Dimension |
Getting Started
Once the drill down Webi report is ready, perform the below steps in Power BI Desktop on the required Multiple Axes Chart.
Step 1: Choose the xViz visual, Multiple Axes Chart for the detailed drill down, in our case we have Product Category & Region added as shown below.
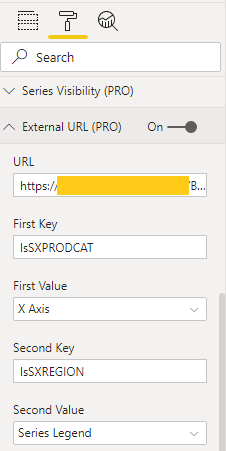
Step 2: Enable ‘External URL’ feature for the chart from the Format menu and provide details of the drill-down Webi Report,
- URL – Webi OpenDoc link
- Key – Name of the prompt defined within the Webi report
- Value – Select the context based on the chart definition
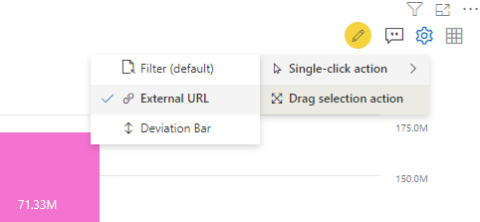
Step 3: Select the Utility icon to change default Single-click action to ‘External URL’ to activate the drill down.
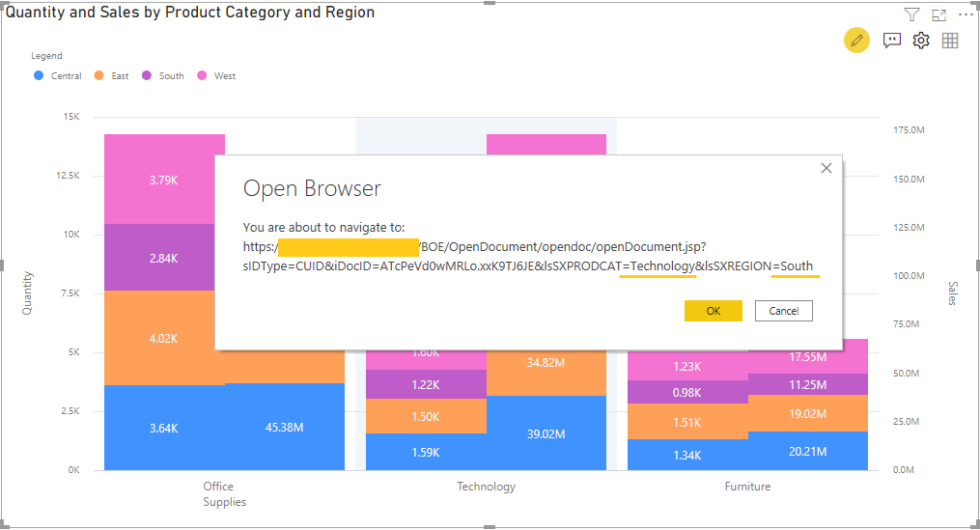
Step 4: When we try to select a value in the chart, a prompt to navigate to the desired Webi is shown with the parameter values based on the user selection.
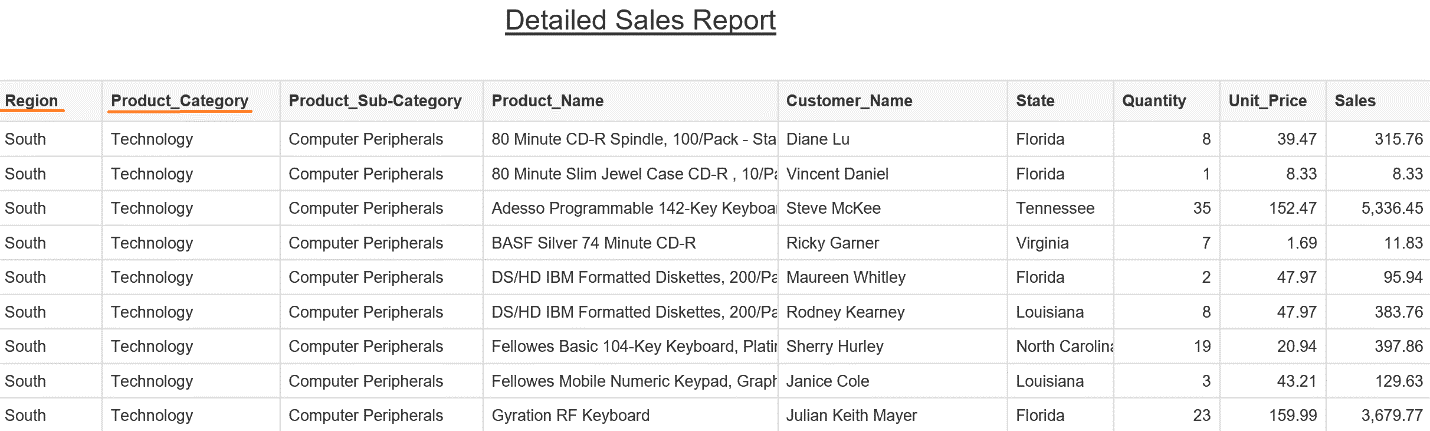
Step 5: When acknowledged, a detailed Webi report is shown with the selected parameter values passed as filters.
By using this “External URL” feature provided by xViz visual, we could drill down to many other external reports or applications and not just restricted to Webi.
***
The xViz Multi Axes Chart is a part of the xViz Pro Suite, check out all the resources for Multi Axes Chart including other blogs, and FREE Power BI Desktop Version!
Check out all the Power BI Visuals in the xViz Pro Suite here