Note: This blog addresses some features that will be available in the App Source in Sep 2019. To get this latest build, reach out to us here.
The Marimekko chart allows you to encode two values (e.g. Revenue & profit margin) along its width and height of each dimension (e.g. product) or a combination of two dimensions (e.g. Products in New York). Let’s look at some of the highlights of this custom visual briefly.
Key Features – Summary
- 100% stacked or a normal Marimekko chart
- Toggle to searchable-table view
- Configurable data labels – Show either or both of height & width values
- Global font configuration
- What’s coming
– Different Number Formatting for Width & Height
Key Features – Description
- 100% Stacked and Normal Marimekko Chart
The Y-axis can be calibrated as 100% stacked or a normal axis.
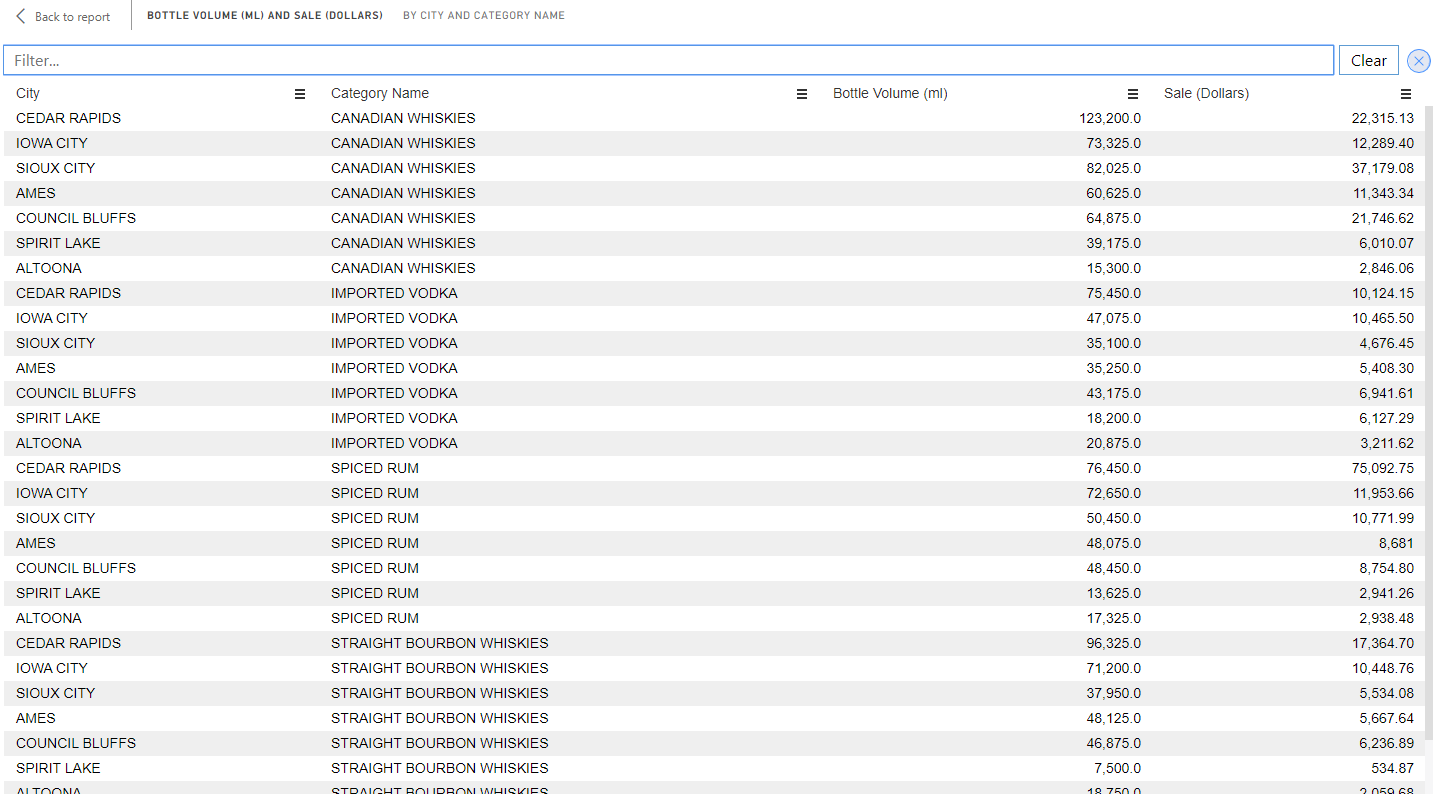
2. Toggle to searchable-table view
When you want to have a detailed look at the data on the visual you can toggle Table View. For this, you can click on the Show Table icon at the right top of the custom visual. Once you click on it, the chart transforms into a table and allows you to perform advanced search on your data.
3. Configure your data labels
The data labels in Marimekko Chart can be configured to show either or both of height & width values along with the legend data labels.
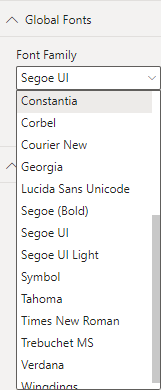
4. Global Font configuration
This feature gives the users to enhance the visual appeal by using various font faces.
We have covered the key features of xViz Marimekko Chart so far but there is more.
***
To get the latest version of the custom visual, reach out to us today here.
You can take a look at the other advanced custom visuals by xViz here.