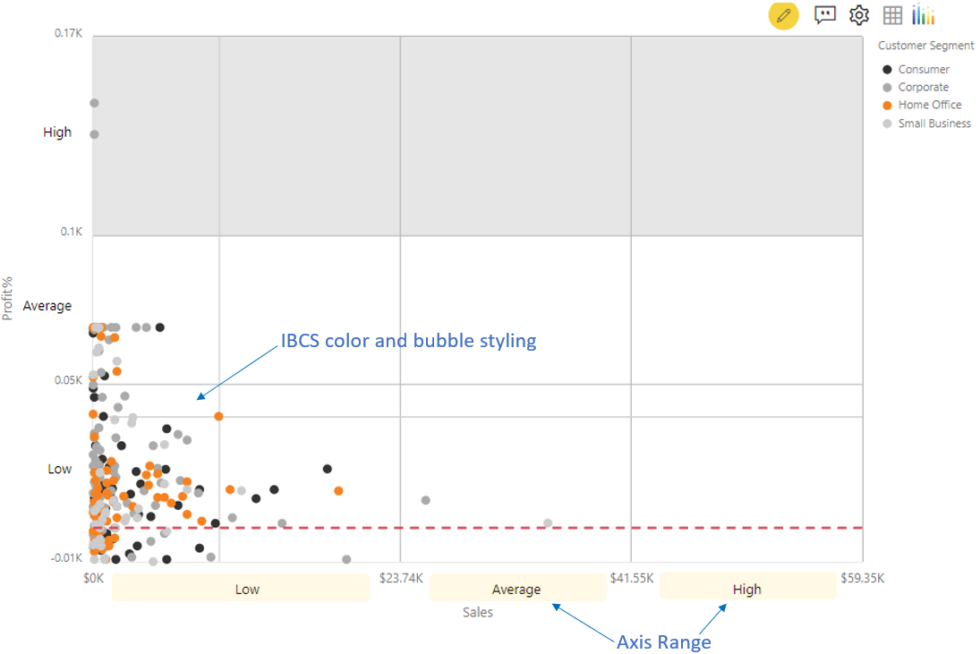
IBCS stands for International Business Communication Standard and defines applying proper conceptual, perceptual, and semantic design to visuals. Along with providing support for standard chart definition and strategic use case, the xViz Bubble/ Scatter also supports IBCS standard use case with dedicated quick-start templates.
The IBCS templates deliver 2 important aspects of the IBCS standard
- Color – The templates come pre-configured with the color and patterns as recommended by IBCS
- Axis Range – Divide the X and Y axis into different segments
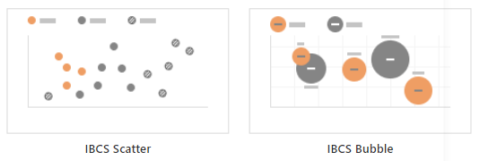
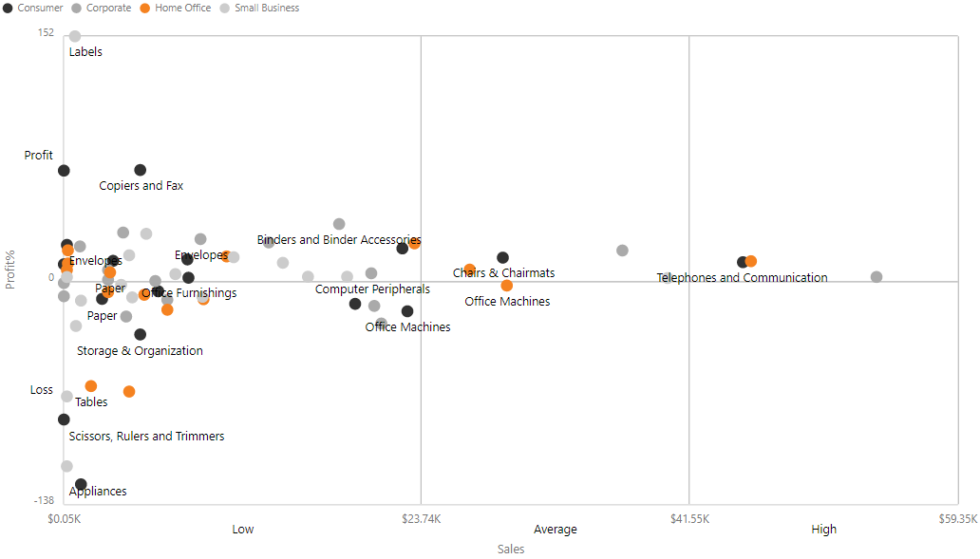
IBCS Scatter
The following example represents Sales and Profit percentage across different products which are grouped by the respective product lines as denoted by their color. The Axis ranges help buckets the data points further into different zones. For example, ‘Labels’ lies under high profit but low sales region.
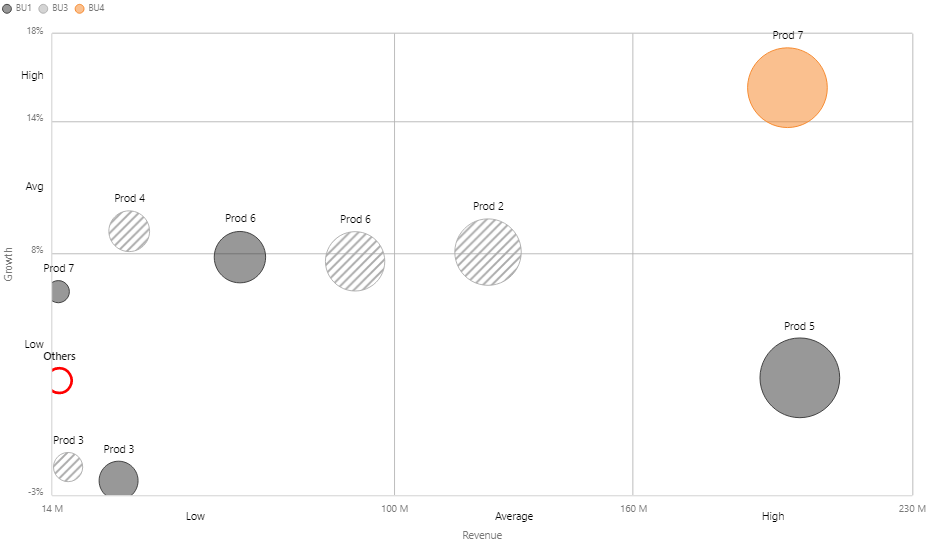
IBCS Bubble
Along with X and Y, the bubble chart provides bubble size as the third variable of information. The below example displays the product Revenue and Growth on the X and Y axis and gross margin by the bubble size. For comfortable viewing, the IBCS Bubble automatically displays the top 10 bubbles and groups the remaining into ‘Others’ bubble(styled differently in red) when there are 15 or more bubbles displayed.
The Bubble Chart is a part of the xViz Pro Suite, download your FREE Power BI Desktop Version here!