When it comes to tracking & monitoring projects, the xViz Gantt Chart can be a very useful tool in your arsenal. The tool offers plenty of enterprise-level features that set it apart, and these features can be set up easily by business users as well. Of these many features, one that we’d like to particularly highlight is the Alerting capabilities of the xViz Gantt Chart.
We do have a separate blog that discusses alerting techniques in the xViz Gantt Chart that tells you what you need to know to get started with setting up conditional formatting. However, this blog will revolve around common use cases in which conditional formatting can be applied to focalize insights for your end-users.
To explain these common business scenarios, we are going to use a sample dataset that contains a few specific fields including planned start & end dates, planned & actual durations, progress, probability of closure, and so forth.
Use Cases:
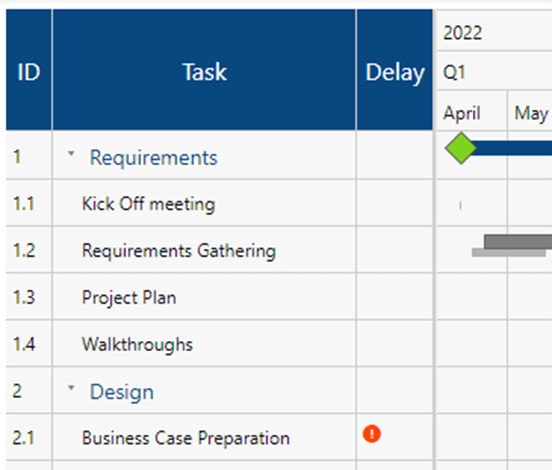
1. Alerts Based on Progress
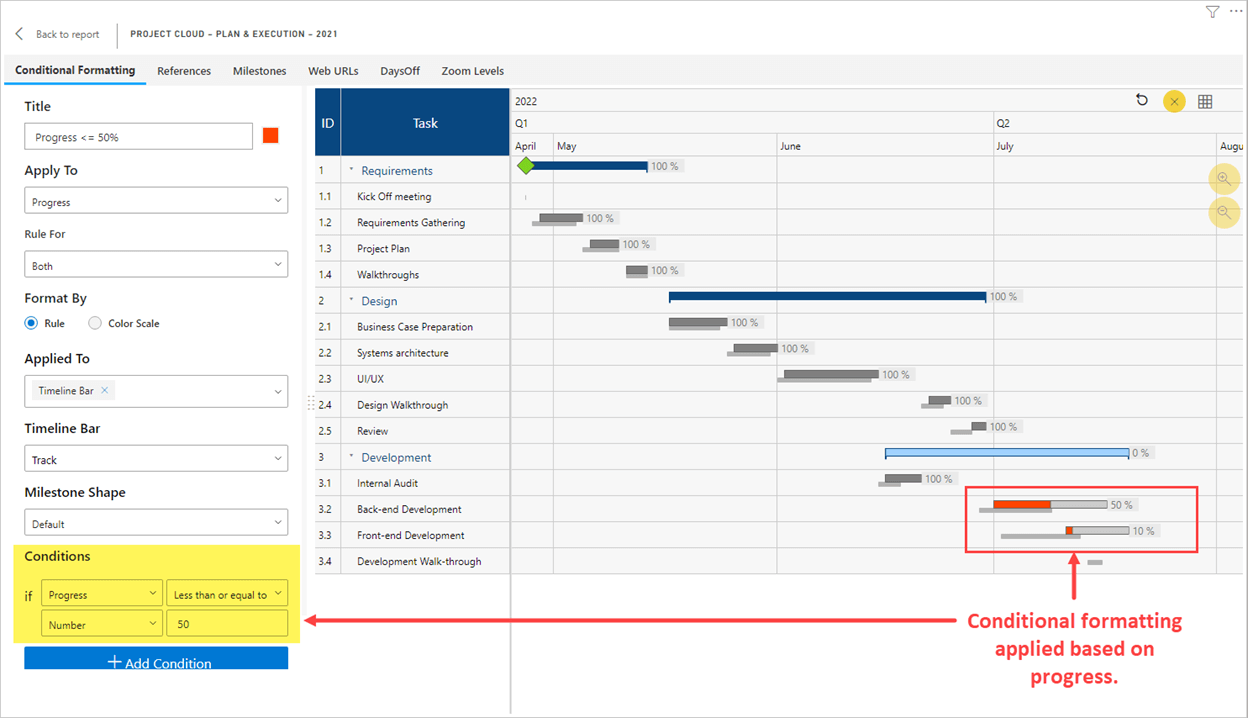
Progress-based Alerts are standard conditional formatting rules that can be set up based on a common project metric such as the current progress or the completion percentage of tasks. These are easy to set up on the xViz Gantt Chart. The rules are easy enough to set up on their own -
If you do have “progress” or “completion” as a metric on your dataset, they’re likely represented by progress bars or bullet charts. In this case, the best way to alert users is to set up alerts directly on the track representing progress on the progress bar.
To achieve the above view, we must insert Quarter in the Category data field and Profit in the Value data field.
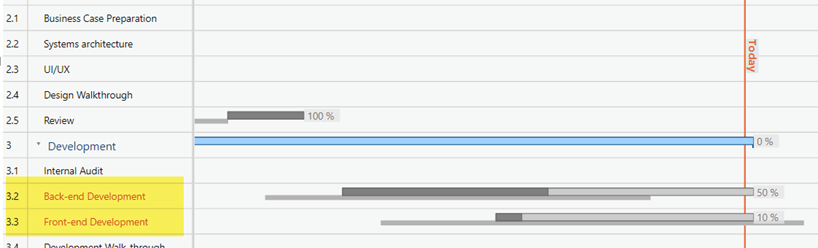
2. Alerts based on Duration
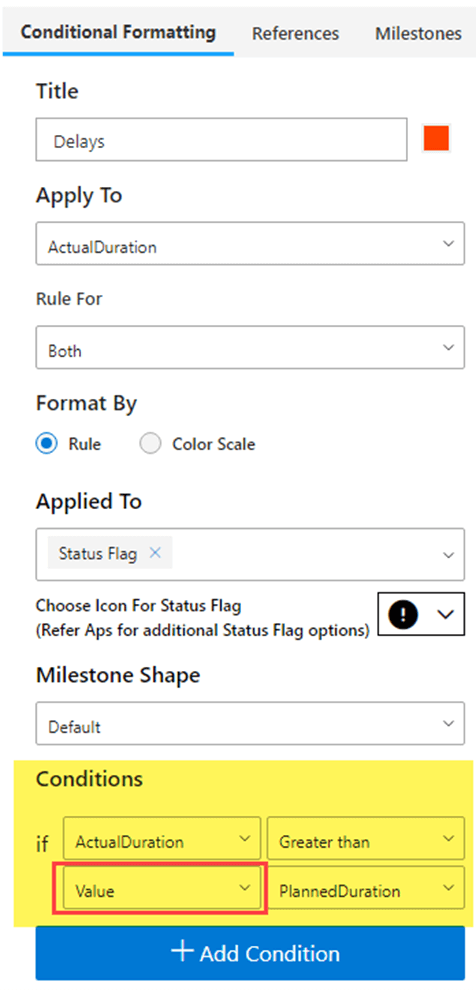
Tracking the duration of individual tasks is vital to ensure that project is running on the track. Therefore, it is imperative to ensure that users are also alerted when the planned duration for a particular task is also exceeded.
When you have the duration of tasks – both planned and actual – on your dataset, you can set up alerts where the actual duration of the project exceeds the planned duration on the xViz Gantt Chart. You can add these measures/calculations to your Gantt Chart as Display Measures (and still hide them from being displayed if you don’t want them to show up). This will allow you to set up alerts based on these measures. In our opinion, one of the best ways to represent this on your project is through the use of a status icon. We’ve given one such example below:
3. Alerts based on Potential Impacts
To get proactive about project timelines, it’s important to identify potential delays and act early. But identifying these kinds of gaps isn’t straightforward – you might need more than a single metric to base your alerts on. This is where the xViz Gantt Chart pulls ahead with the ability to conditionally format based on multiple metrics or conditions.
To do this, you only have to set up multiple conditions based on the metrics you wish to compare and choose how they’re combined – using an AND (to indicate ALL conditions must hold true) or an OR (to indicate any one of the conditions must hold true).
For instance, in the example below, we have set up an alert to identify potential delay points by using a calculated measure named “DaysToGo” (which calculates how many days are left until the task meets or exceeds the planned duration from the current date). The condition first looks to see if a task is ongoing (by seeing if the Actual End Date for the task is blank) AND also checks to see if there are less than 5 days left to complete it. Based on this, it sets up an alert by highlighting the task on the data grid.
Click image to enlarge
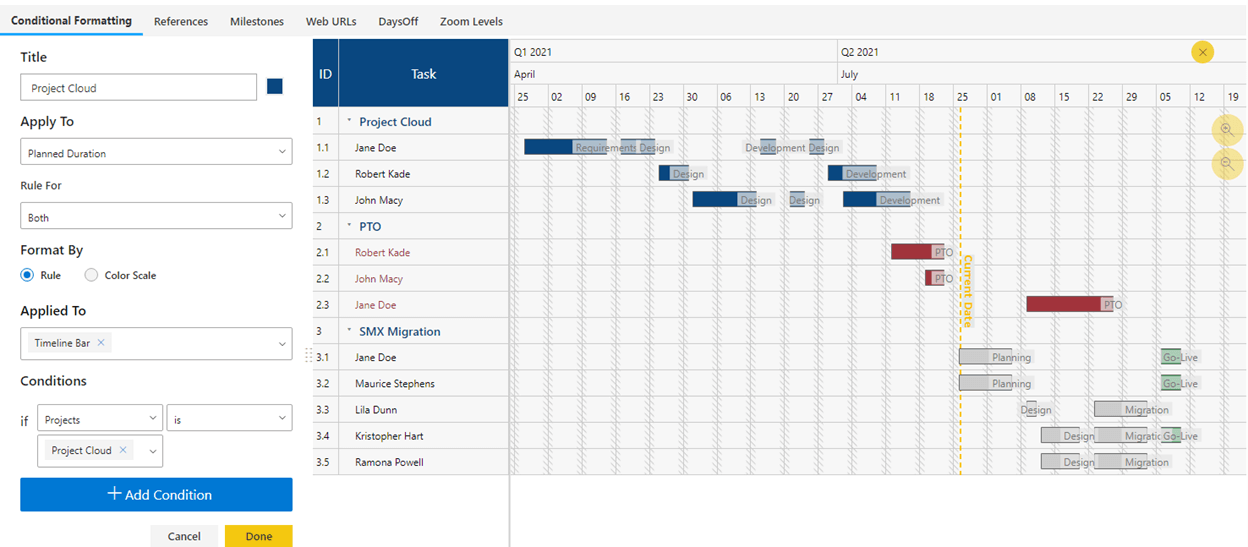
4. Conditional Formatting based on Groups
This type of scenario may not always be encountered while using Gantt Chart but is another scenario to be covered, nonetheless. In certain situations, you may want to group your tasks together visually by colorizing them. The xViz Gantt Chart allows for this type of conditional formatting by allowing you to set up alerts based on a list of possible values.
We found this type of scenario makes a lot of sense on a Gantt Resource chart. For instance, let’s say that you have project allocations & availability for all your resources presented on the Gantt Resource Chart. You would like to visually display similar projects together and highlight the timespan in which members are on PTO. This is easily possible by highlighting the timelines based on the name of the project, or other display categories that you can include in the xViz Gantt Chart. We’ve shown this example in the screenshot below.
**********
The xViz Gantt Chart has a range of different options to configure conditional formatting or alerts based on different scenarios or conditions. Paired with the power of Microsoft Power BI and the ability to create calculations or columns using DAX, there is a wide range of scenarios that you can put this feature on the Gantt Chart to use.
Over 1100 customers to date have chosen xViz visualizations like the Gantt Chart for the range of customizations and the rich feature set that they offer. Do keep an eye out on our blogs, webinars, and videos to find out more about how you can use xViz!