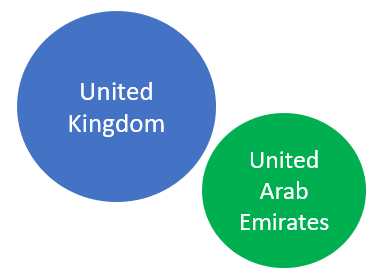
The xViz Packed Bubble chart is similar to the Bubble chart wherein the bubbles are tightly packed rather than spread over the X and Y-axis. It requires a single category and value to begin with where the Category field defines the individual bubbles and value represent the bubble size.
You can enable interaction features like drill-down, grouping, or clustering based on different chart configurations. For example, by assigning more than one category to the chart enables the drill-down mode and by assigning a legend filed enables the clustering or grouping mode. Let us now read more on the different chart configurations and key features the xViz Packed Bubble Power BI Custom Visual has to offer.
Key Features – Summary
- Data Label Customization
- Cluster Mode
- Grouping Bubble by Category
- Conditional Formatting
- Customize Bubble size
- Number Formatting
- Different Color Customizations
Key Features – Description
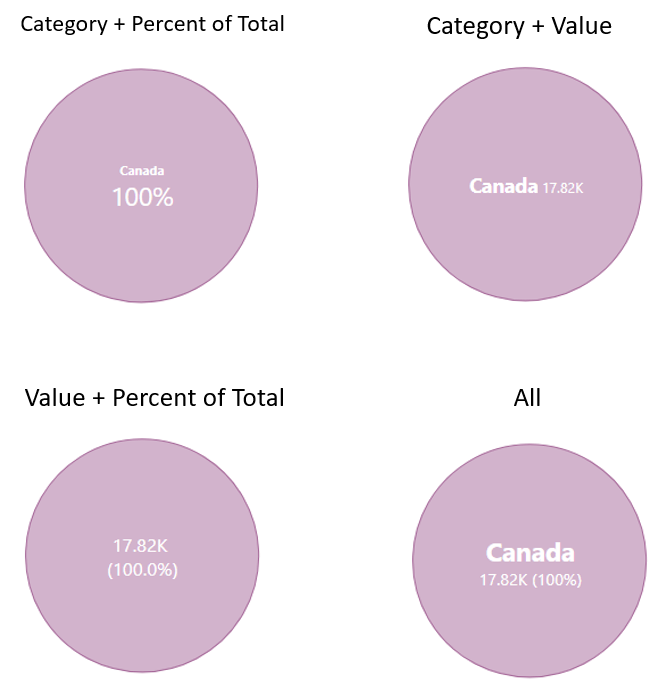
- Data Label Customization
The xViz Packed Bubble Chart provides several different data label formats – a combination of category, value, and percentage of the total to choose from:
Data label Formats:
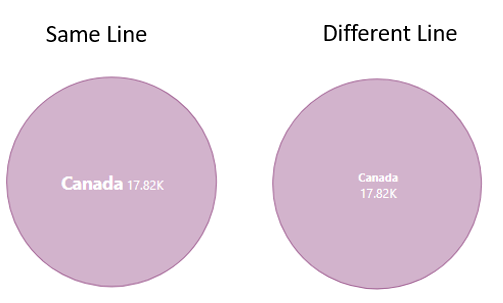
Placement Option: Based on the data label length and real estate available you can decide to either show the category and value on the same line or different line
Text Scaling: To accommodate long labels, you can choose responsive text. The responsive text will change the font size base on the bubble size’ where the larger bubbles have slightly bigger font as compared to smaller ones.
2. Cluster Mode
The Cluster Mode option shows up once the legend field is assigned. On activating the cluster mode, all the bubbles get grouped under different clusters. Along with this, the cluster size helps you limit the categories/ bubbles you see under each cluster and display totals option will display the totals of each cluster when hovering over individual bubbles.
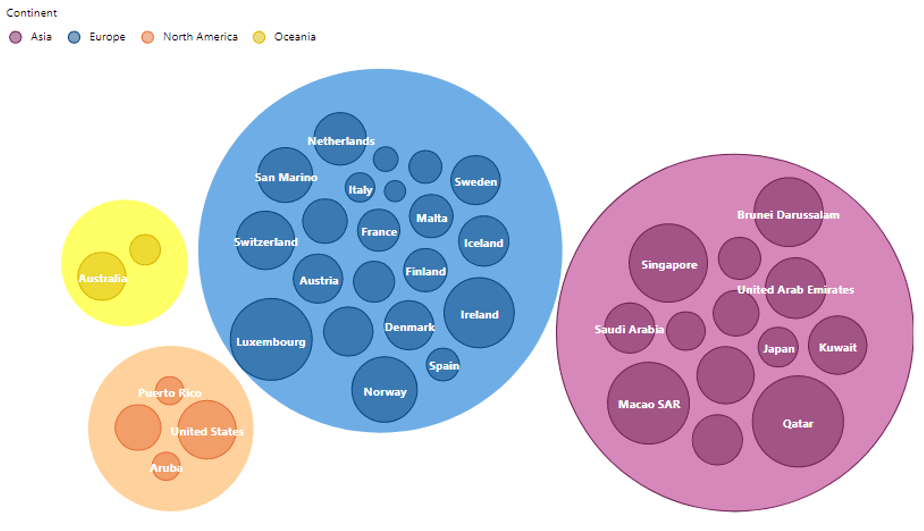
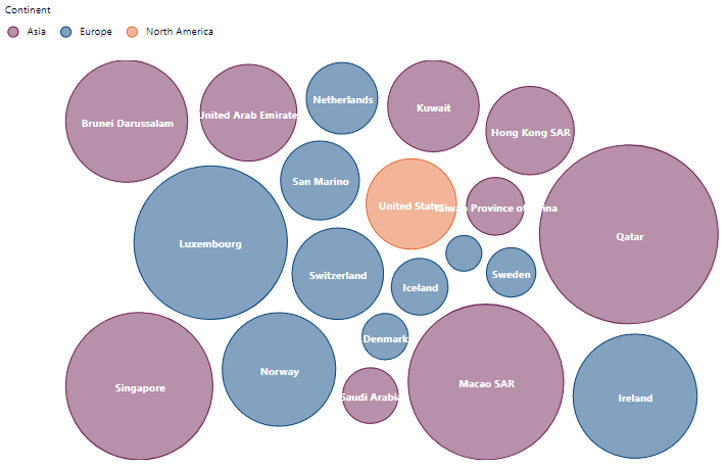
3. Grouping Bubble by Category
The Grouping mode is the default option when a legend field is assigned to the Packed Bubble chart. It colors the codes and splits the bubbles further based on the assigned legend field.
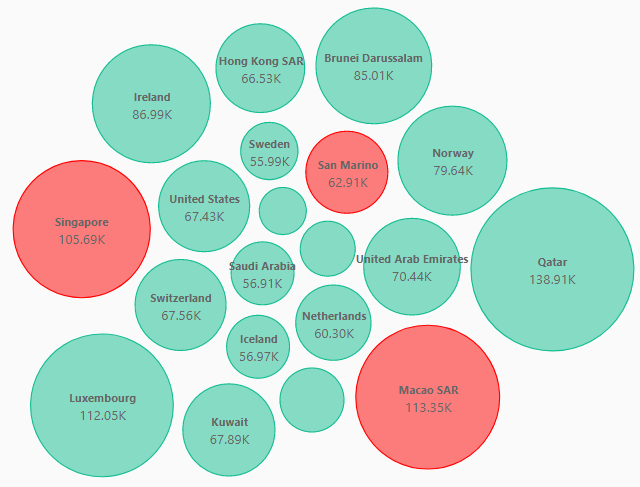
4. Conditional Formatting
Conditional formatting is a standard feature across all our xViz charts. You can color code the bubbles based on different business logic for altering or highlighting outliers.
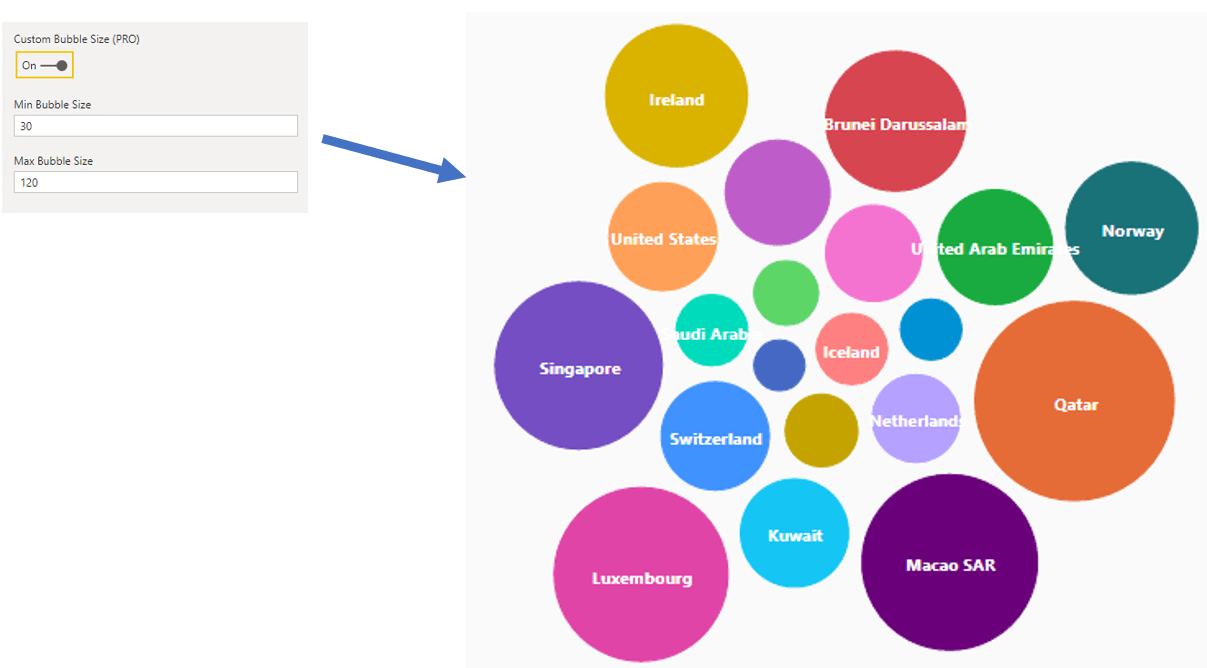
5. Customize Bubble Size
This feature is especially useful where there is a vast difference with the max and min value due to which the smaller values would hardly be visible. You can alter the Bubble size and define your min and max bubble size to view the smaller bubbles easily.
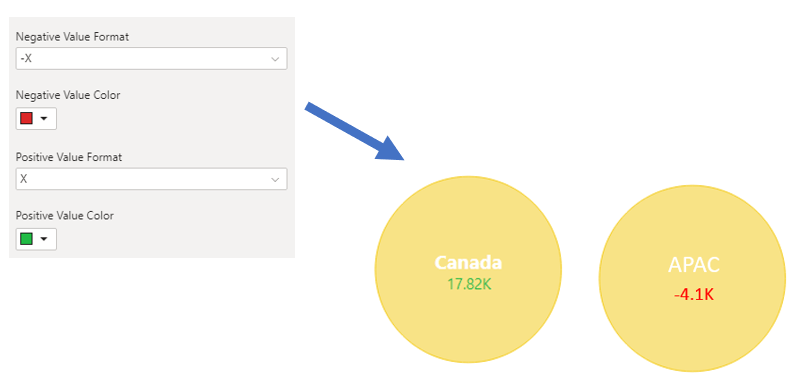
6. Number Formatting
The xViz Packed Bubble chart provides the user with different number formatting options like different scaling, prefix & suffix, separate decimal place option for value and percentage of total and semantic formatting option
7. Different Color Customizations
The xViz Bubble chart provides different coloring options which are as follows:
- Single color
- Color-based on Power BI
- Min/ max color
***
Get your xViz Suite for Power BI Desktop with all the pro features unlocked here.
Learn about all the advanced Power BI Visuals offered in the xViz Suite here.