One of the latest addition to the xViz Pro Suite is Radar/Polar Advanced Visual is highlighted in the Power BI Desktop Summary Blog for the month of April 2020. The blog highlights many functionalities of the Radar/Polar Power BI Visual and how they close the gaps discussed in Power BI Ideas Place.
The xViz Pro Suite including Radar/Polar Power BI Visual is available for free with all the Pro functionalities unlocked for Power BI Desktop.
Following are the list of Key Features for xViz Radar/Polar Chart
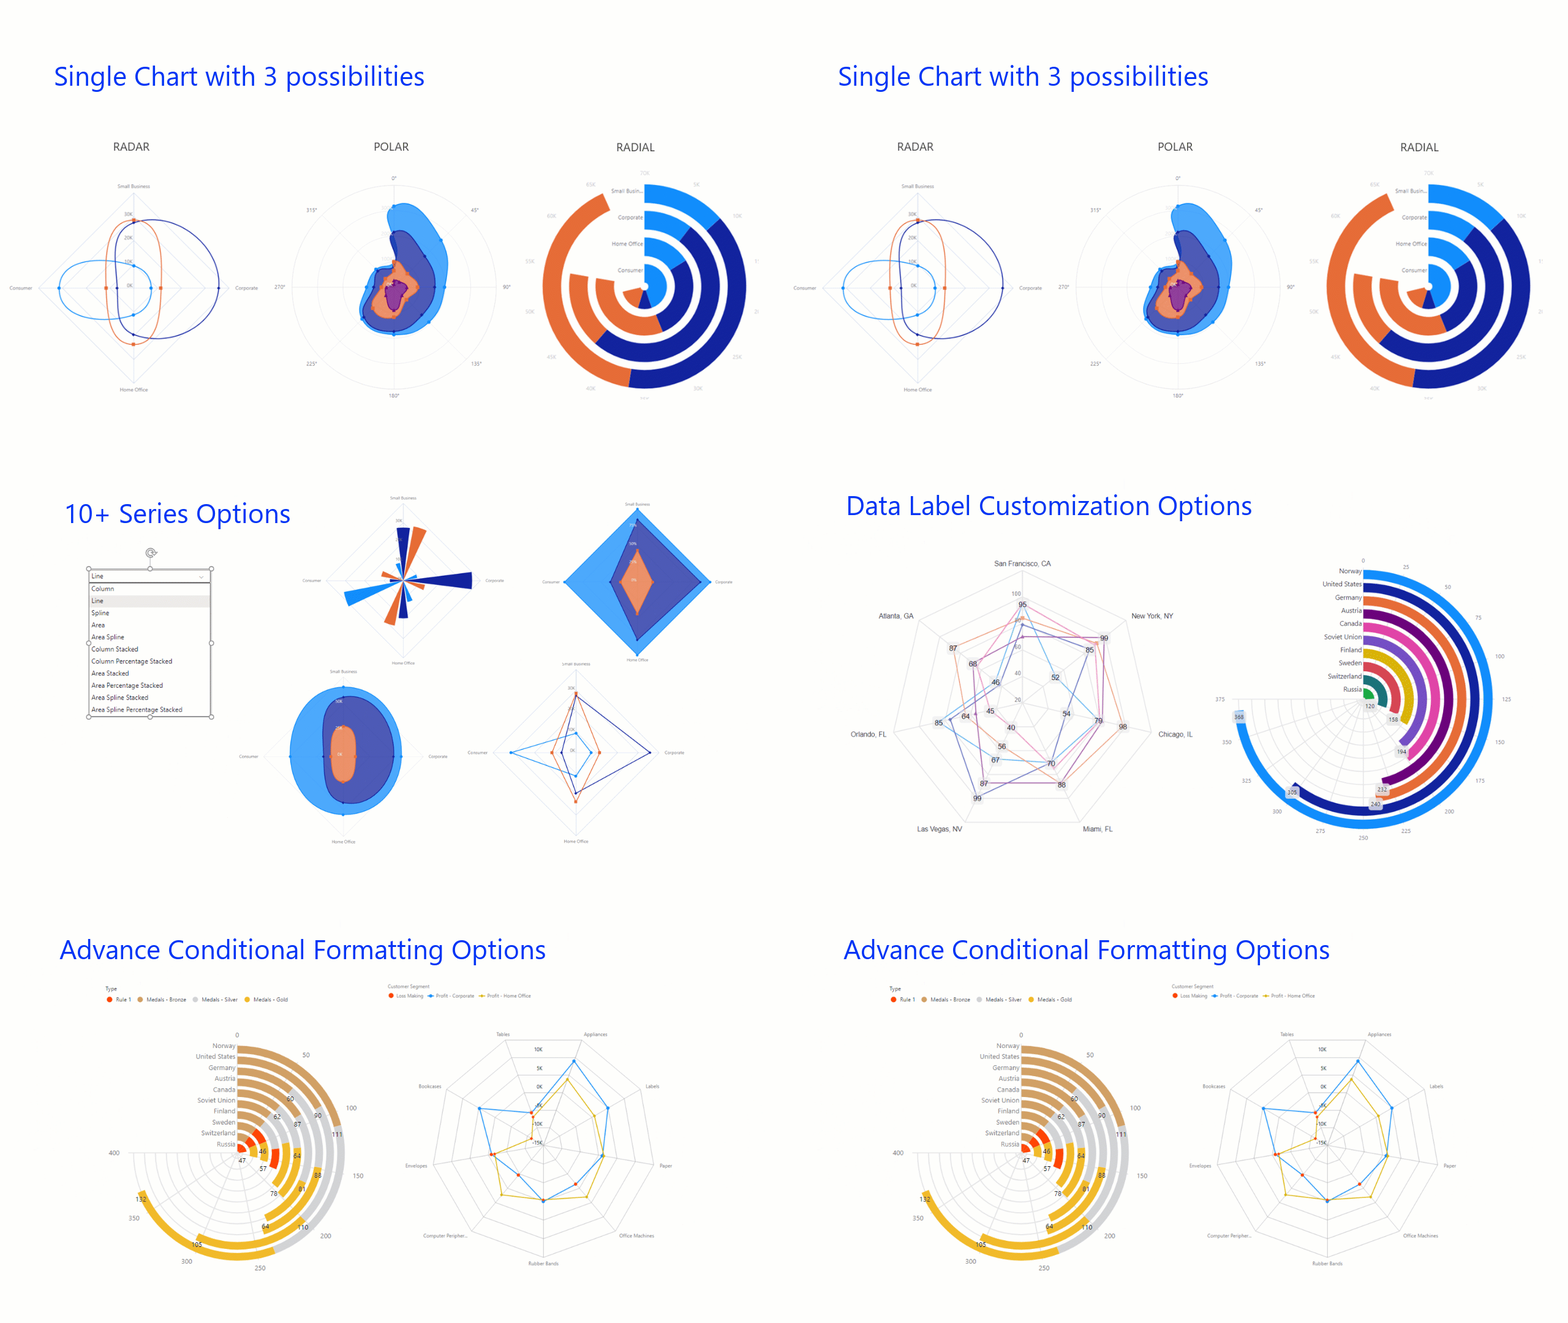
- 3 -in- 1 Chart: Choose between Radar, Polar and Radial Visualizations;
- 10+ Series Options: Display Line, Column, Area, Stacked, Stacked Percentage
- Advance data label customization with support for totals display in case of the Stacked Radial chart
- Axis customization: Automatically or manually set the axis min and max value
- Support for legend
- Advanced Conditional formatting for visually highlighting outliers based on different rules
- Number formatting options to customize values based on various business scenarios
- Summary table: Tabular view of data

Check out the blog by Sujata Narayana here.
***


