The newly PBI Certified Waterfall Visual with its enhancements and latest key feature additions to the xViz Advanced Trellis are highlighted in the Power BI Desktop Summary Blog of September 2020!
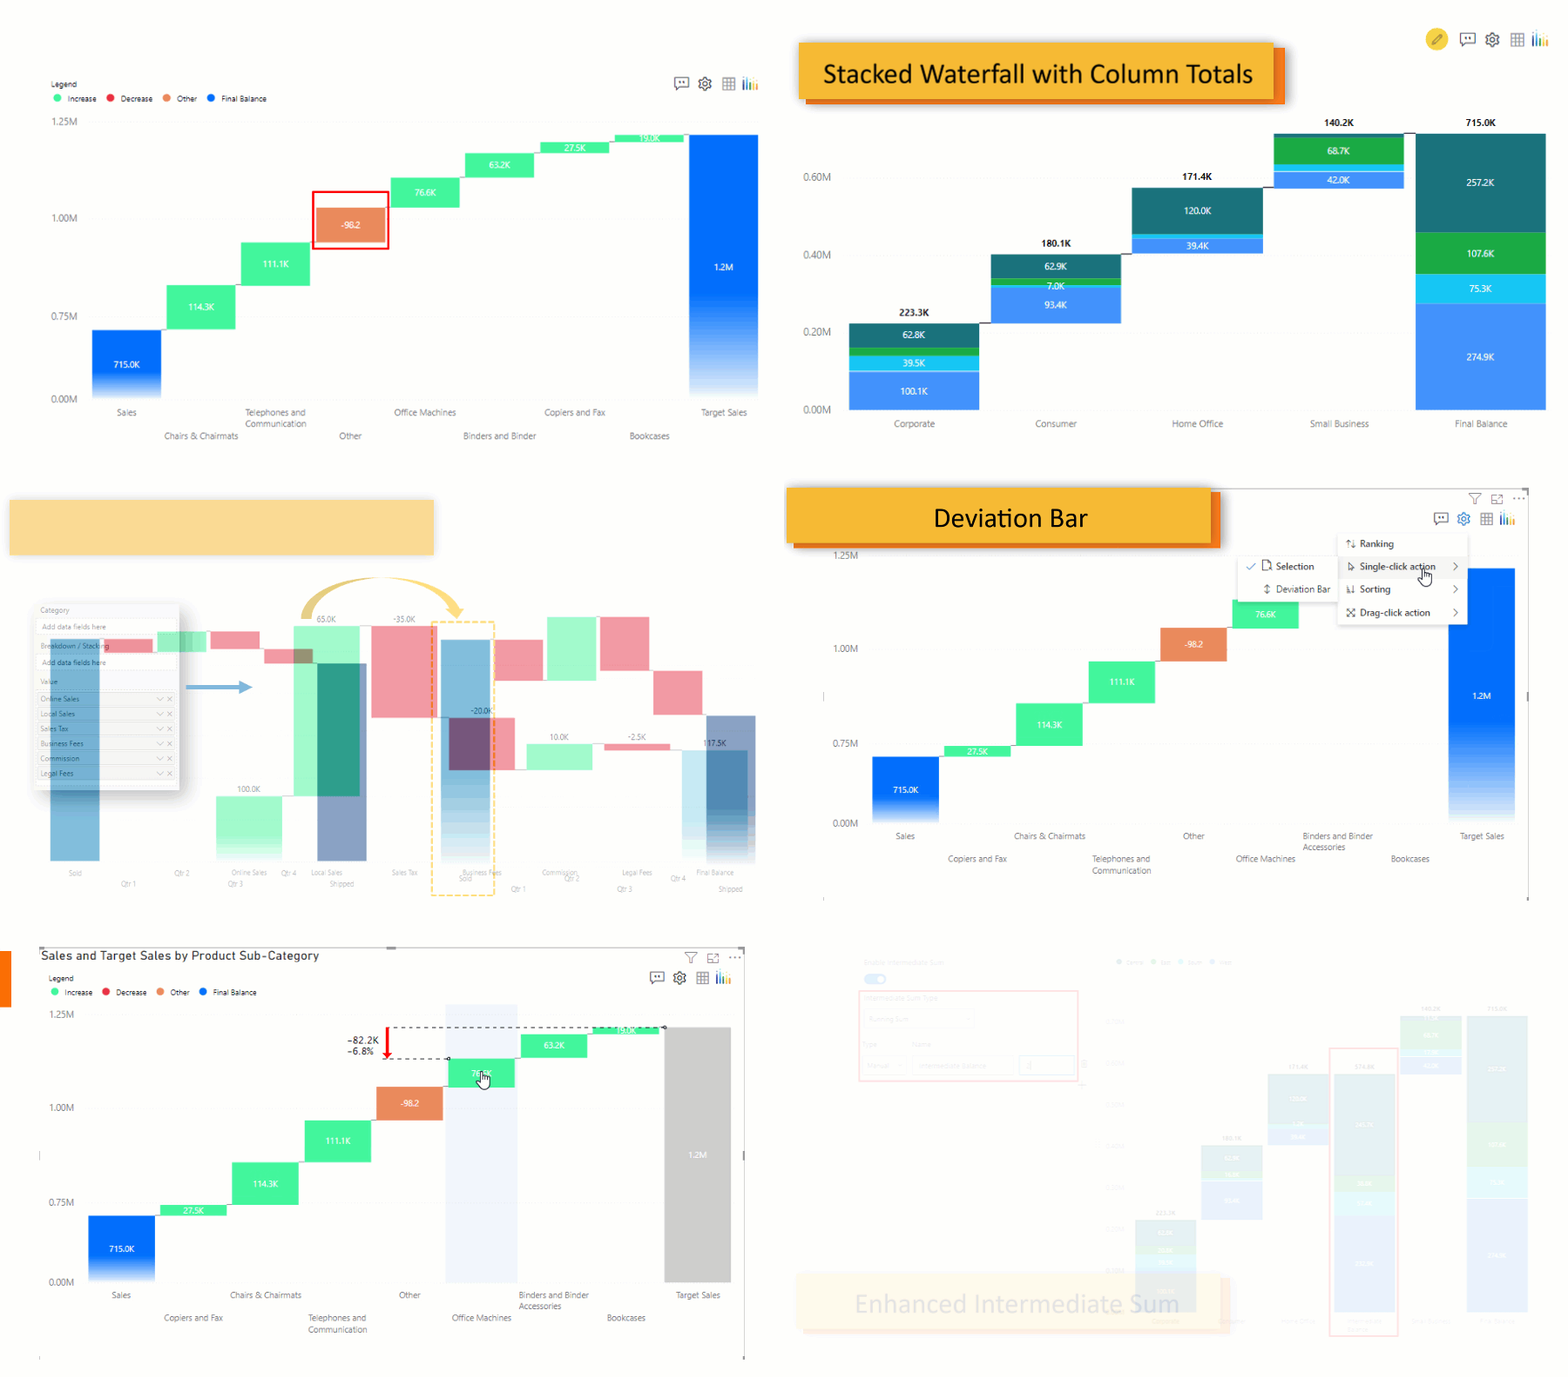
The Blog highlights some of the Key Features of the Waterfall Chart that are most requested in Ideas Place, which include the Stacked Waterfall chart option and ‘Only values waterfall’ along with existing use cases of Variance & breakdown analysis. There are also other important feature additions such as Ranking, Annotations, and many more that help the users create enhanced storytelling with their data.
The list of key features include:
- Top ‘N’ with ‘Others’ bar
- Annotations
- Stacked waterfall chart with stacked tooltip and column totals
- Only Values use case
- Improved Axis Break experience
- New X-Axis label formatting options – word wrap and step like
- Sorting for Breakdown Analysis
- Deviation bar
- Legends support
- Intermediate Sum UI/ UX

The Advanced Trellis Visual includes enhancements and updates such as several new chart types, features, and improved UX. 10+ new chart options have been added with dedicated Styling and Data Label section to style each chart individually. Improved chart readability with additional layout option – Row scale and Top/Bottom ‘N’ ranking on chart level to focus on key drivers.
The key enhancements include:
- New chart options –
- Normal Charts
- Specialty Charts
- Stacked Chart
- New Conditional Formatting options
- Search with Pinning option
- Ranking – Top N Charts Ranking
- New Scale option – Row scale
- Animation Section enhancements
- Animated Title option
- Styling options for selected, unselected mode
- Looping option
- Speed(Delay)
- Updated Styling option for each Chart
- Time Series Support
- Axis Label Density
- Tooltip Enhancements
- Tooltip fields well
- Synchronized Tooltip
- Stacked Chart Tooltip
- Data Label Enhancements
- Colored marker for data label
- Contrasting Data label color
- Legend color for stacked charts

Read the Microsoft Power BI Desktop Summary Blog September 2020 Edition here.
You can take a look at the other xViz advanced custom visuals here.


