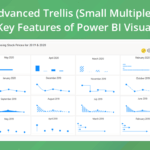
This blog is part of the xViz Advanced Trellis Blog Series
We are proud to announce the latest version of xViz Advanced Trellis (aka Small Multiples) V 1.1.5 with several new chart types, features, and improved UX. Following are the list of new features and enhancements
Key Features – Summary
- New chart options –
- New Conditional Formatting options
- Search with Pinning option
- Ranking – Top N Charts Ranking
- New Scale option – Row scale
- Animation Section enhancements
- Updated Styling option for each Chart
- Time Series Support
- Axis Label Density
- Tooltip Enhancements
- Data Label Enhancements
- Legend color for stacked charts
Key Features – Description
- New Chart Options
10+ new charts have been added to the xViz Advanced Trellis along with their styling and data label section –
- Specialty Charts –Variance Waterfall chart, Variable width Pie/ Donut
- Stacked Charts – Column and an Area percentage chart
- Single Value Charts – Waterfall chart, Pie & donut family charts with total
![Key Enhancements to the Advanced Trellis/Small Multiples [v1.1.4] Power BI Visual](https://xviz.com/wp-content/uploads/key-enhancements-to-advanced-trellis-small-multiples-power-bi-custom-visual-1.gif)
2. New Conditional Formatting options
Apart from conditional formatting on the chart, you can now set different rules for conditional formatting for coloring your chart title and background as well. In the case of Panel and Animated title, icons can also be added to support different use cases:
- Panel Titles and Animated Titles with Icons
![Key Enhancements to the Advanced Trellis/Small Multiples [v1.1.4] Power BI Visual](https://xviz.com/wp-content/uploads/key-enhancements-to-advanced-trellis-small-multiples-power-bi-custom-visual-2.png)
- Chart Background
![Key Enhancements to the Advanced Trellis/Small Multiples [v1.1.4] Power BI Visual](https://xviz.com/wp-content/uploads/key-enhancements-to-advanced-trellis-small-multiples-power-bi-custom-visual-3.png)
3. Search with Pinning option
A new feature has been added to the panel runtime options where you can now Search and Pin the panels. The search operation makes it easier to locate and pin the panel when you have multiple pages. Pinning makes the panel fix the location on each page, thereby making it easier to compare with other panels instead of jumping back and forth between different pages.
![Key Enhancements to the Advanced Trellis/Small Multiples [v1.1.4] Power BI Visual](https://xviz.com/wp-content/uploads/key-enhancements-to-advanced-trellis-small-multiples-power-bi-custom-visual-4.gif)
4. Ranking enhancements –
- Top ‘N’ Charts – As the name suggests you can display Top/ Bottom ‘N’ items and group the remaining as others within each chart. With this new update, you can now have two ranking options, one which can be set on the Panel level, and the other is done on the chart level.
![Key Enhancements to the Advanced Trellis/Small Multiples [v1.1.4] Power BI Visual](https://xviz.com/wp-content/uploads/key-enhancements-to-advanced-trellis-small-multiples-power-bi-custom-visual-5.png)
- ‘Both’ option for Ranking – Along with Top/ Bottom ‘N,’ you can display ‘Both’ of these together. Consider an example of a chart showing Sales for 10 different Regions. If the ‘Both’ option is selected and the value entered is 2, then you would notice four items being displayed – Top 2 and Bottom items 2 being displayed. This way the user can focus on Top and Bottom items together and group remaining as others. This new option is available for Ranking in both Panels and Charts.
![Key Enhancements to the Advanced Trellis/Small Multiples [v1.1.4] Power BI Visual](https://xviz.com/wp-content/uploads/key-enhancements-to-advanced-trellis-small-multiples-power-bi-custom-visual-6.png)
5. Row scale
Adding to the list of different scale options is the Row scale. As seen in the below image, the row scale option is a common scale shared across each row instead of the trellis(small multiple). Hence, making it easier to read as there is little variability across the charts within a row than the entire trellis.
![Key Enhancements to the Advanced Trellis/Small Multiples [v1.1.4] Power BI Visual](https://xviz.com/wp-content/uploads/key-enhancements-to-advanced-trellis-small-multiples-power-bi-custom-visual-7.png)
6. Animation Section enhancements
The Animation section is only visible when Animation mode is enabled(Trellis Type = Animated charts). The Animation section has been beefed up with new features like Title option, additional styling control for each control type, ability to loop, and set the speed of the animation axis.
- Animated Title option – Title display for each Animation category item with the ability to display values like Panel titles.
- Styling options for selected, unselected mode – Styling option for Dropdown, slider control, and play button for selected and unselected mode.
- Looping option – Ability to loop the animation feature
- Speed(Delay) – Set the speed / delay(in seconds) to move to the next item
![Key Enhancements to the Advanced Trellis/Small Multiples [v1.1.4] Power BI Visual](https://xviz.com/wp-content/uploads/key-enhancements-to-advanced-trellis-small-multiples-power-bi-custom-visual-8.png)
7. Updated Styling option for each chart type
Each chart has a dedicated styling option section where you can further customize it. For example, in the case of a line chart, you can choose from different Line options (line, spline, and step), stroke width, and marker customization which are added to the chart selection option. The following are some examples of customized charts using the styling tab properties.
![Key Enhancements to the Advanced Trellis/Small Multiples [v1.1.4] Power BI Visual](https://xviz.com/wp-content/uploads/key-enhancements-to-advanced-trellis-small-multiples-power-bi-custom-visual-9.png)
8. Time series Support
The xViz Advanced Trellis chart now supports a time series analysis use case where the X-Axis automatically scales to accommodate time series data.
![Key Enhancements to the Advanced Trellis/Small Multiples [v1.1.4] Power BI Visual](https://xviz.com/wp-content/uploads/key-enhancements-to-advanced-trellis-small-multiples-power-bi-custom-visual-10.png)
9. Axis label density
Another supporting feature for the Time series analysis use case is the Axis label density, which helps declutter and read a long or large number of axis labels with ease in the Small Multiples Visual. The different axis label density display options are as follows:
- Display First and Last label
![Key Enhancements to the Advanced Trellis/Small Multiples [v1.1.4] Power BI Visual](https://xviz.com/wp-content/uploads/key-enhancements-to-advanced-trellis-small-multiples-power-bi-custom-visual-11.png)
- Display every Nth Label – Instead of showing every label you can customize the X-axis to skip labels to accommodate large labels and avoid cluttering
![Key Enhancements to the Advanced Trellis/Small Multiples [v1.1.4] Power BI Visual](https://xviz.com/wp-content/uploads/key-enhancements-to-advanced-trellis-small-multiples-power-bi-custom-visual-12.png)
10. Tooltip enhancement
- Tooltip field added – A new field well has been added for Tooltips in Small Multiples so that the user can display additional values as part of the tooltip.
![Key Enhancements to the Advanced Trellis/Small Multiples [v1.1.4] Power BI Visual](https://xviz.com/wp-content/uploads/key-enhancements-to-advanced-trellis-small-multiples-power-bi-custom-visual-13.png)
- Synchronized Tooltip – Found under the general settings tab, the synchronize tooltip feature helps view information for the same item (X-axis category) across the different categories in Trellis. Thereby making it easy to view and compare values.
![Key Enhancements to the Advanced Trellis/Small Multiples [v1.1.4] Power BI Visual](https://xviz.com/wp-content/uploads/key-enhancements-to-advanced-trellis-small-multiples-power-bi-custom-visual-14.gif)
- Stacked chart tooltip
![Key Enhancements to the Advanced Trellis/Small Multiples [v1.1.4] Power BI Visual](https://xviz.com/wp-content/uploads/key-enhancements-to-advanced-trellis-small-multiples-power-bi-custom-visual-15.png)
11. Data Label
- Colored marker for line charts – Colored markers have been added for line charts to highlight the key data points based on the data label display settings.
![Key Enhancements to the Advanced Trellis/Small Multiples [v1.1.4] Power BI Visual](https://xviz.com/wp-content/uploads/key-enhancements-to-advanced-trellis-small-multiples-power-bi-custom-visual-16.png)
- Contrasting Data label color –Often time the readability of the data labels get compromised due to the position of the data labels, where some data label are placed inside and others outside in the same chart due to real estate issues. This issue can be overcome using contrasting data label property which sets the color of the data labels automatically based on the background-color
![Key Enhancements to the Advanced Trellis/Small Multiples [v1.1.4] Power BI Visual](https://xviz.com/wp-content/uploads/key-enhancements-to-advanced-trellis-small-multiples-power-bi-custom-visual-17.png)
12. Legend color for stacked charts
The legends colors for the stacked chart can be found under the advanced editor Tab of the visual
![Key Enhancements to the Advanced Trellis/Small Multiples [v1.1.4] Power BI Visual](https://xviz.com/wp-content/uploads/key-enhancements-to-advanced-trellis-small-multiples-power-bi-custom-visual-18.png)
***
The xViz Advanced Trellis is a part of the xViz Pro Suite, check out all the resources including other blogs, and FREE Power BI Desktop Version!
Check out all the Power BI Visuals in the xViz Pro Suite here