It is important to keep track of the progress, resource availability, and delays in project management. The xViz Gantt Chart offers the capability of implementing Conditional Formatting, enabling users to highlight data based on specific conditions and criteria.
Conditional Formatting enables the prioritization of tasks and milestones based on data-driven rules. Using Conditional Formatting in the Gantt chart enhances the data visualization in the form of coloring the bar, changing the shape, highlighting the color of the milestone, altering the data grid font color, and/or using different status flag symbols.
Methods to implement Conditional Formatting:
The xViz Gantt Chart provides the capability to apply conditional formatting using Rules or Color Scale, as shown below:
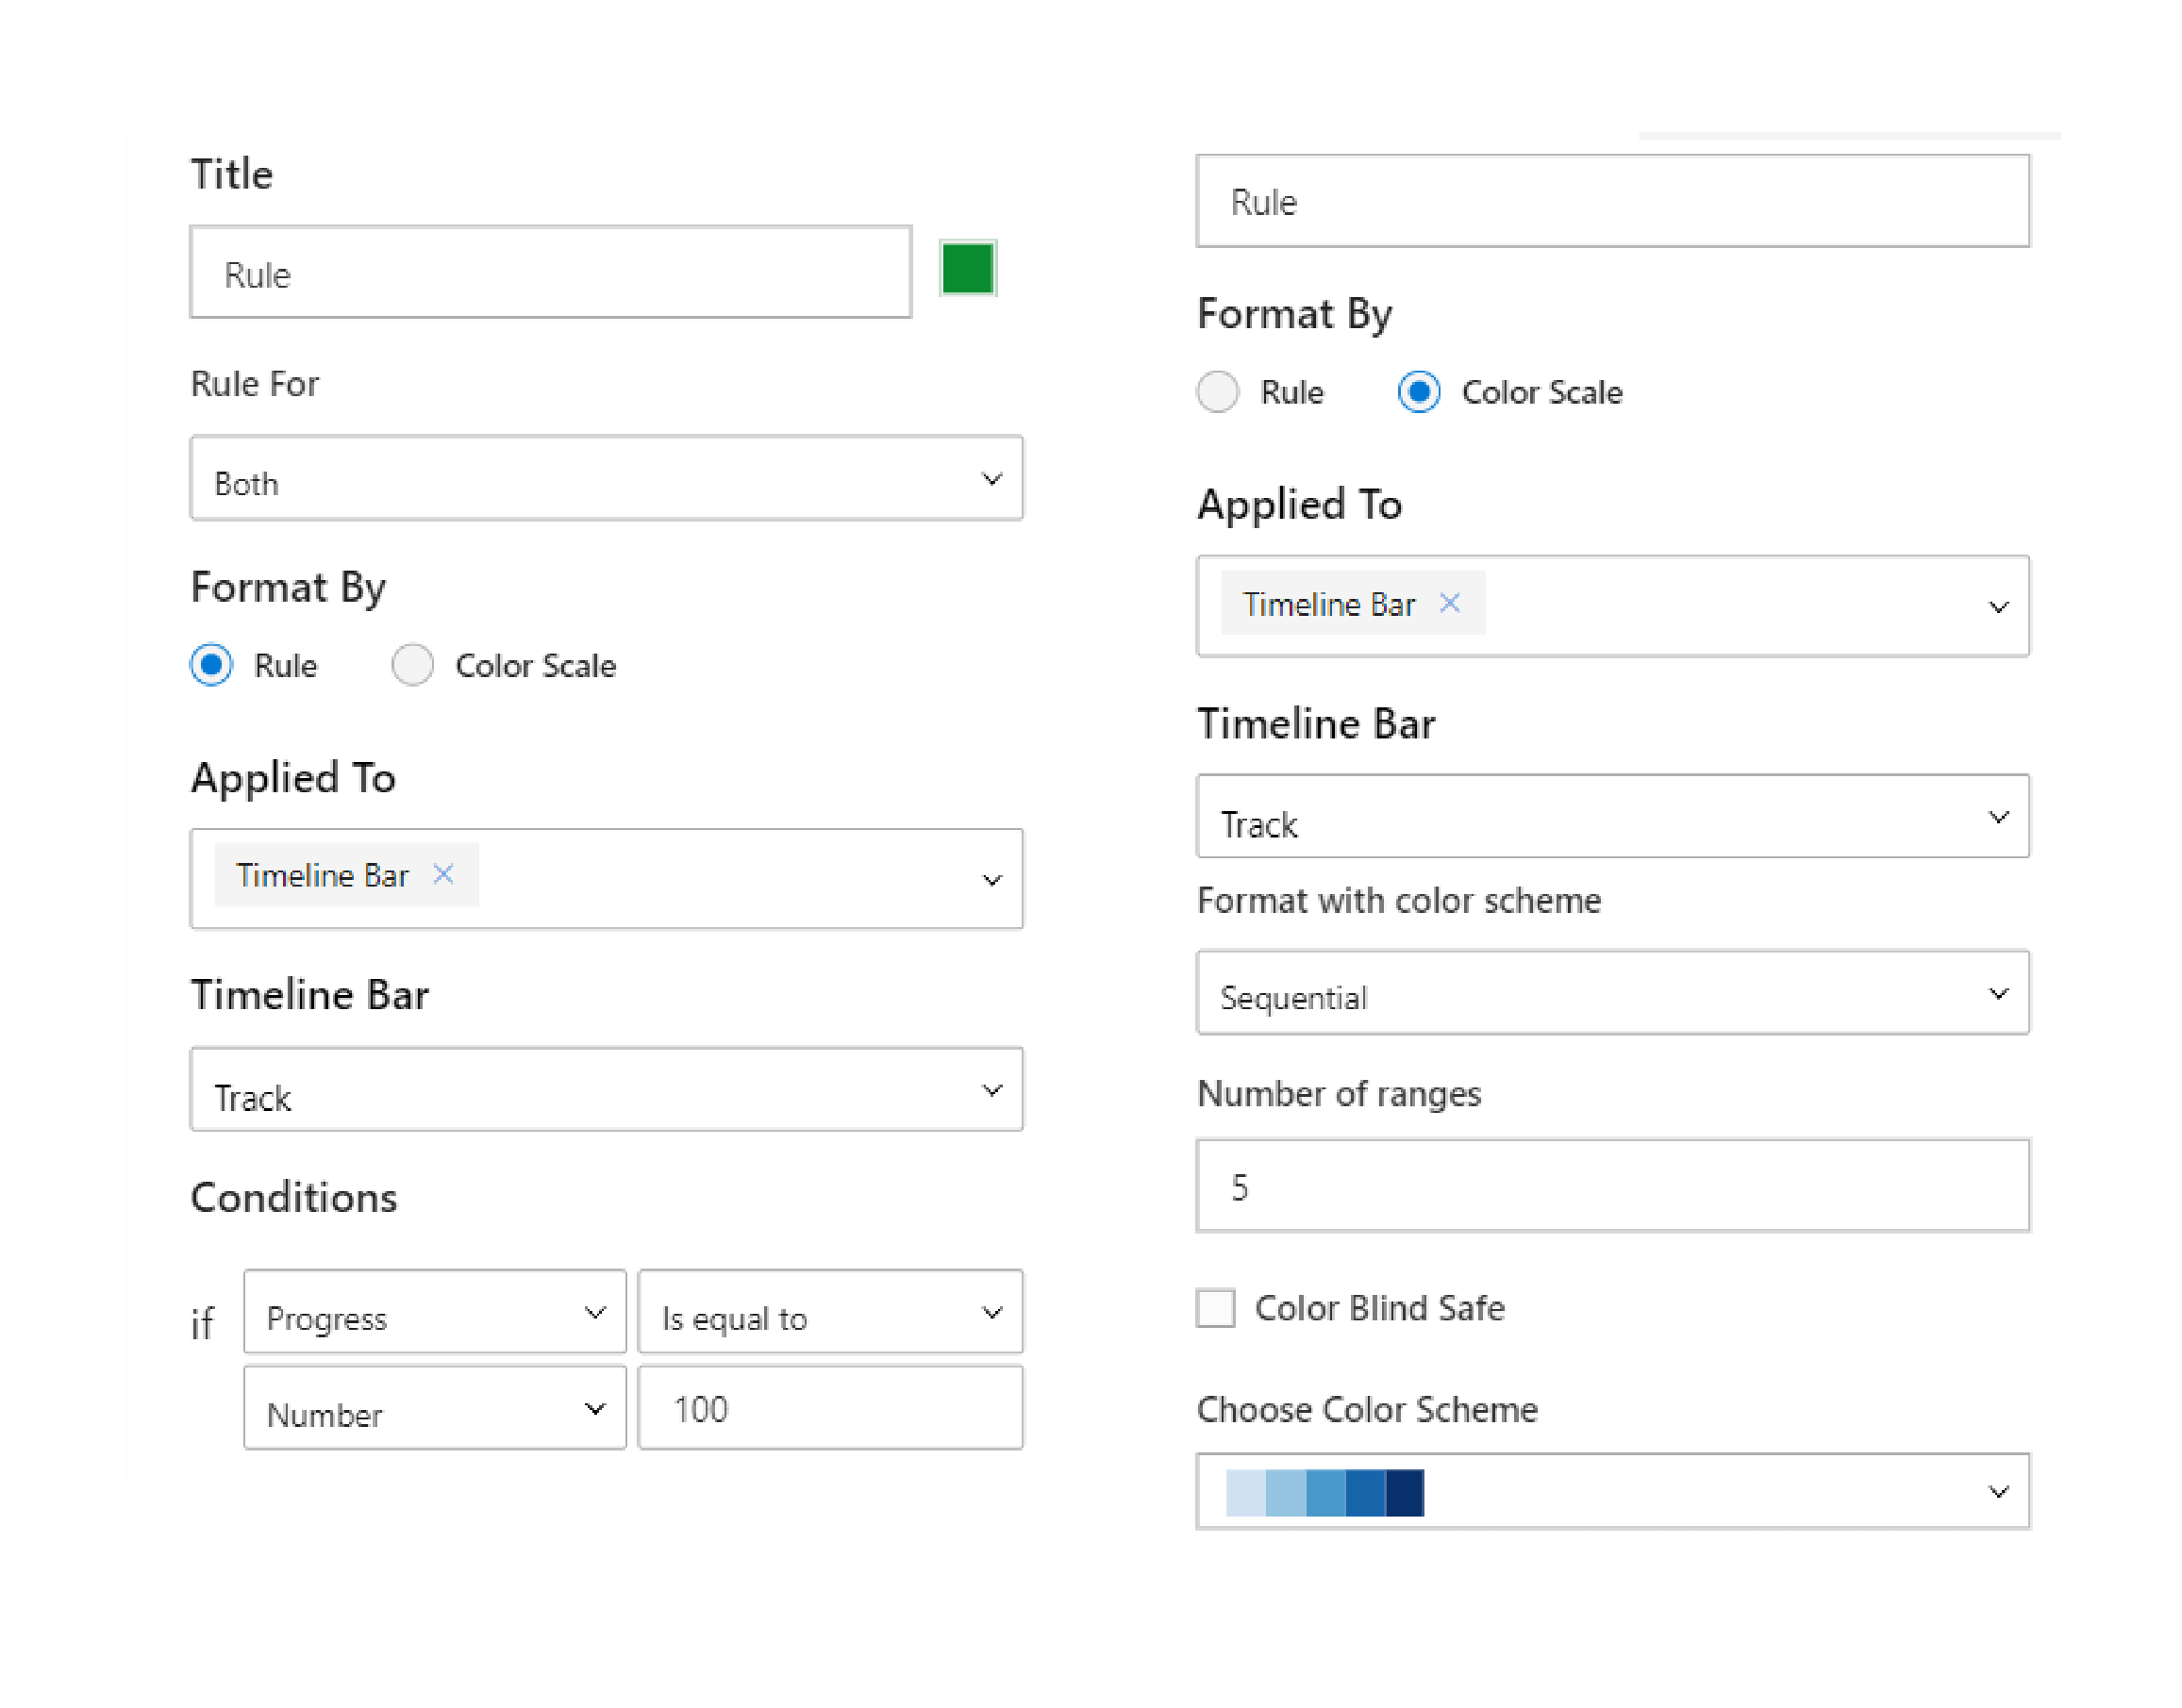
- Rules-based formatting: Define specific conditions using the data column and threshold values which can be static or data-driven.
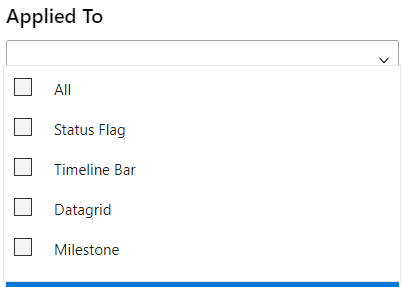
- Color Scale formatting: Apply a color scheme to indicate the magnitude of progress. We can Apply Conditional Formatting on Milestone, Timeline Bar, Data Grid, and Status Flag.
Learn more about Conditional Formatting here.
Conditional Formatting using Status Flag Symbols:
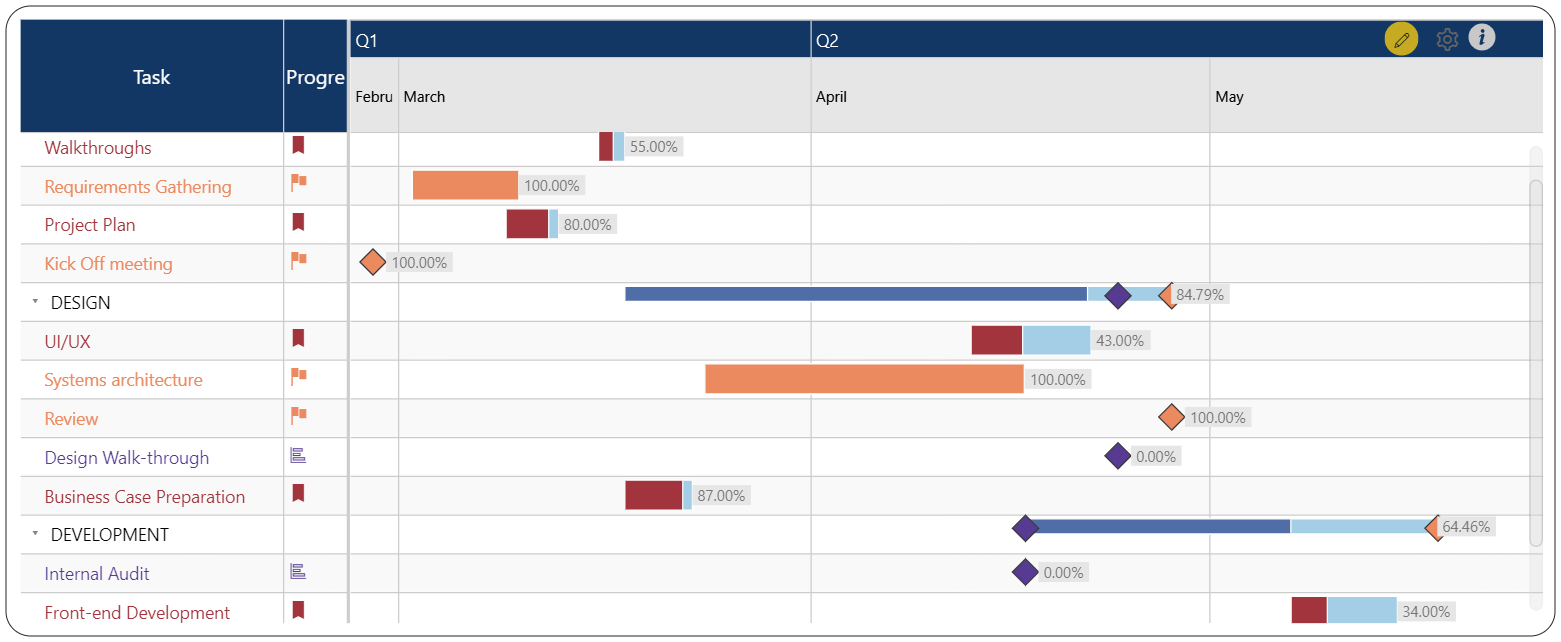
Consider a scenario where a project is in its planning phase, with the team actively gathering requirements and strategizing for design and development. To facilitate easy tracking of team progress by the manager, the report can have a variety of symbols with different colors to provide at-a-glance insights into the progress status in the timeline. This allows the manager to quickly assess progress without looking into detailed data.
Status Flag can be used on multiple rules simultaneously. We can highlight each condition with different symbols and can use different colors to highlight those symbols.
Consider the Conditions where -
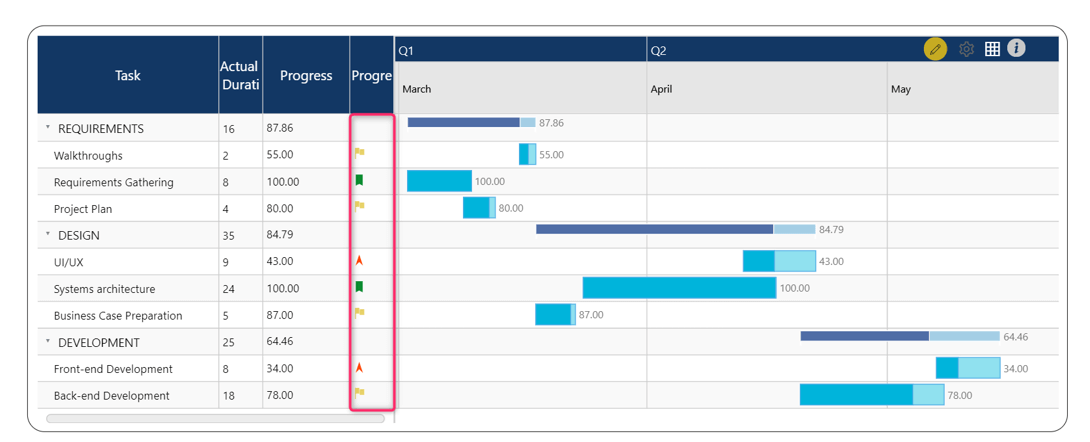
1. When the progress reaches 100%, it is marked with a Green Bookmark symbol for highlighting

2. The team is actively engaged, and their progress falls within the range exceeding 50%, highlighted with the Yellow Flag symbol

3. The team has recently initiated their tasks and has not yet reached the halfway completion point, highlighted with the Red Upward Symbol

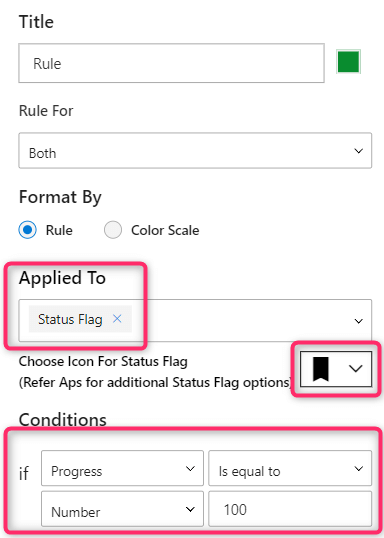
To set up the flag-based conditional formatting, add conditional formatting as shown in the screenshot below. Key configurations include:
- Color of the symbol
- Applied To: Status Flag
- Icon for the status flag
- Condition
Here is an example of the configuration for 100% progress status condition mentioned above:
Simialrly, when all the three conditions are configured, the result is as shown below:
The xViz Gantt Chart provides a range of distinct 260+ symbols and provides the search option based on the requirement.
In xViz Gantt Chart you can use different techniques to highlight and represent various data-driven conditions. Check out the Alerting Technique blog for more on Conditional Formatting in the xViz Gantt Chart.
Explore the different functionalities of the xViz Gantt Chart (Microsoft Certified) from Microsoft AppSource here.