In this blog, we will walk you through the steps to leverage condition formatting in xViz Gauges i.e. Linear & Advanced Gauge.
One of the most common methods of analyzing the health of the KPI is by using conditional formatting. xViz Gauges – linear & angular gauge comes with advanced conditional formatting options, which helps you to leverage them in few steps.
xViz Conditional Formatting – Display options
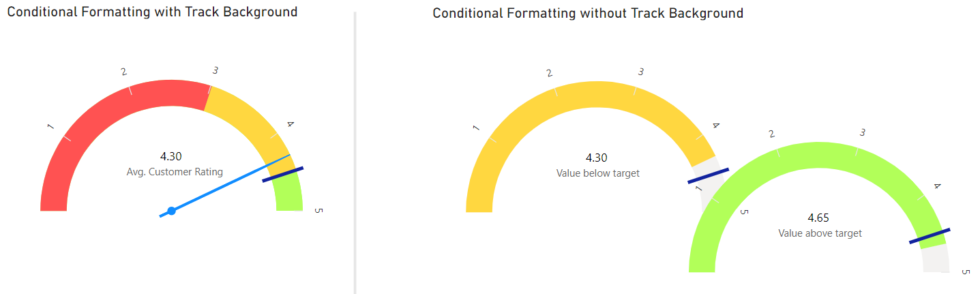
- With Track background – Conditional format is applied to the background scale and value is tracked with the help of the needle
- Without Track background – Value of the KPI is highlighted in single color based on defined conditional formatting similar to visual, Power BI Radial gauge
Configuring Conditional Formatting for Gauges
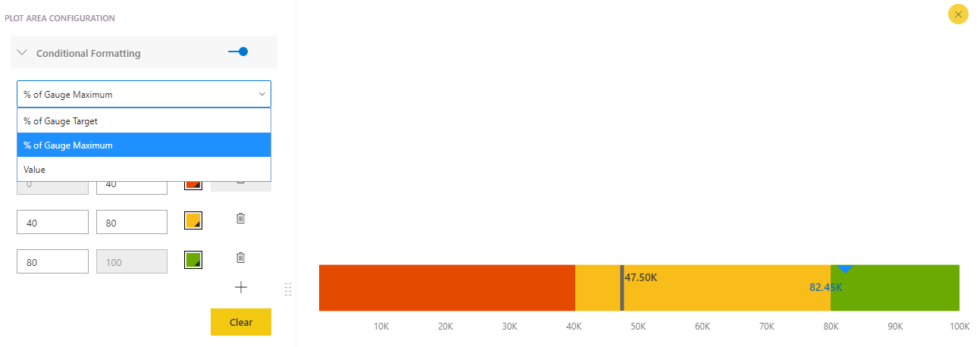
There are 3 ways you can define conditional formatting using xViz Gauge
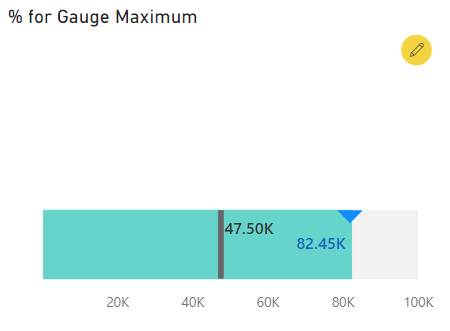
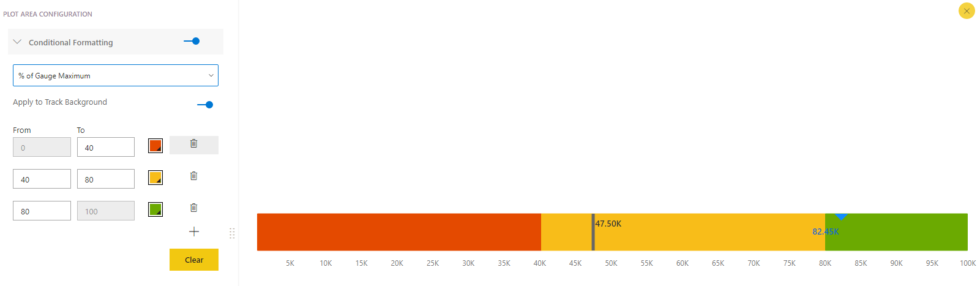
- % of Gauge Maximum (default) – Color ranges based on percentages of Maximum value.

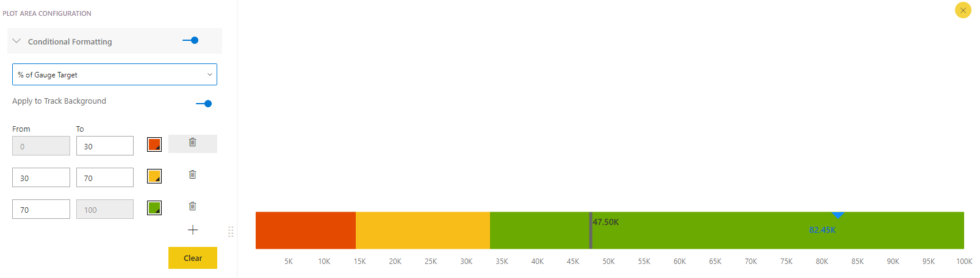
2. % of Gauge Target – Color ranges are defined based on percentages of Target valueNote: This option will only show when you have a Target field assigned to the chart or configured in Additional property sheet (APS)
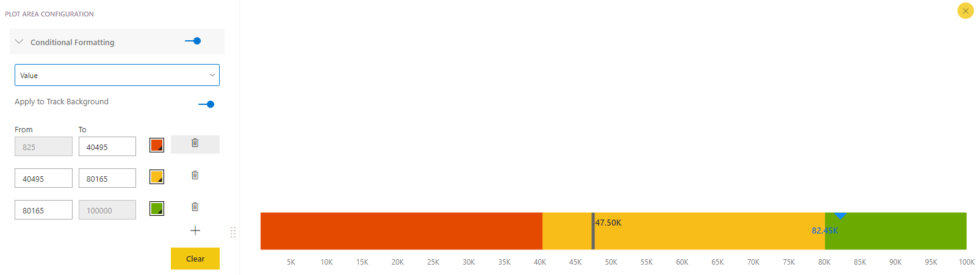
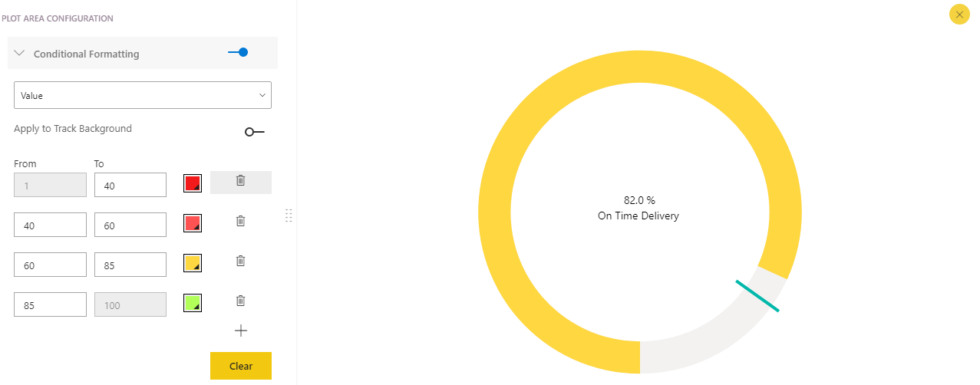
3. Value – Color ranges based on static value
Steps to configure conditional formatting
- 1: Choose the xViz Gauge to add conditional formatting and select the Edit icon on the right top of the visual as shown below, to open advanced editor & configure conditional formatting
2: Enable conditional formatting under plot area configuration to see the xViz Linear Gauge and select the option by which you like to configure your gauge from the dropdown. As above mentioned you need a “Target value” field in order to select “% of Gauge Target”.
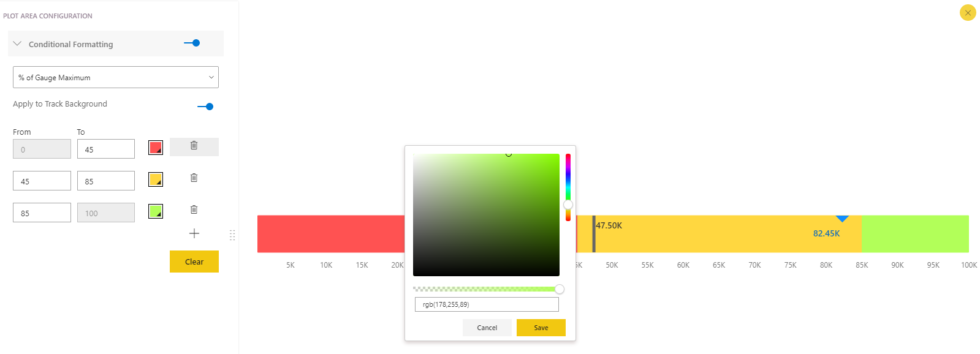
3: Configure the end values in each range and see the consecutive start values gets updated automatically. You can also change your range color based on your need using color codes.
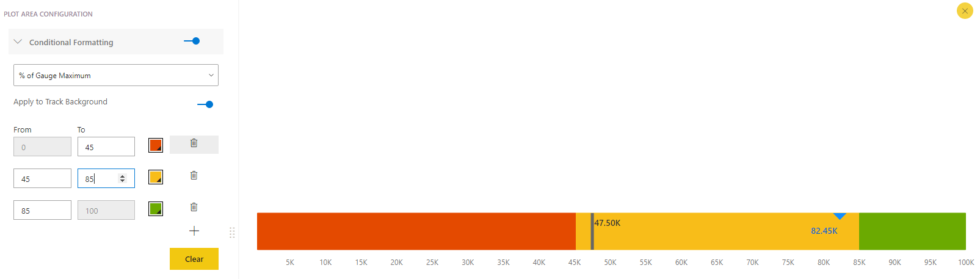
You can use add/delete range icon to add or delete based on your range classification.
- Clear button can be used for ‘Revert to default’ action.
- Disable ‘Apply to track Background’ in case you want see the color of the KPI based on the condition rather than its position with conditional ranges.
In the below shown example, xViz Advanced Gauge is configured to show the health of the KPI based on defined conditions
4: Close the Advanced editor once you are done with the changes and follow the same steps if you like to configure for a different xViz Linear/Advanced Gauge.

***
To get the latest version of the custom visual, reach out to us here.
You can take a look at the other advanced custom visuals by xViz here.