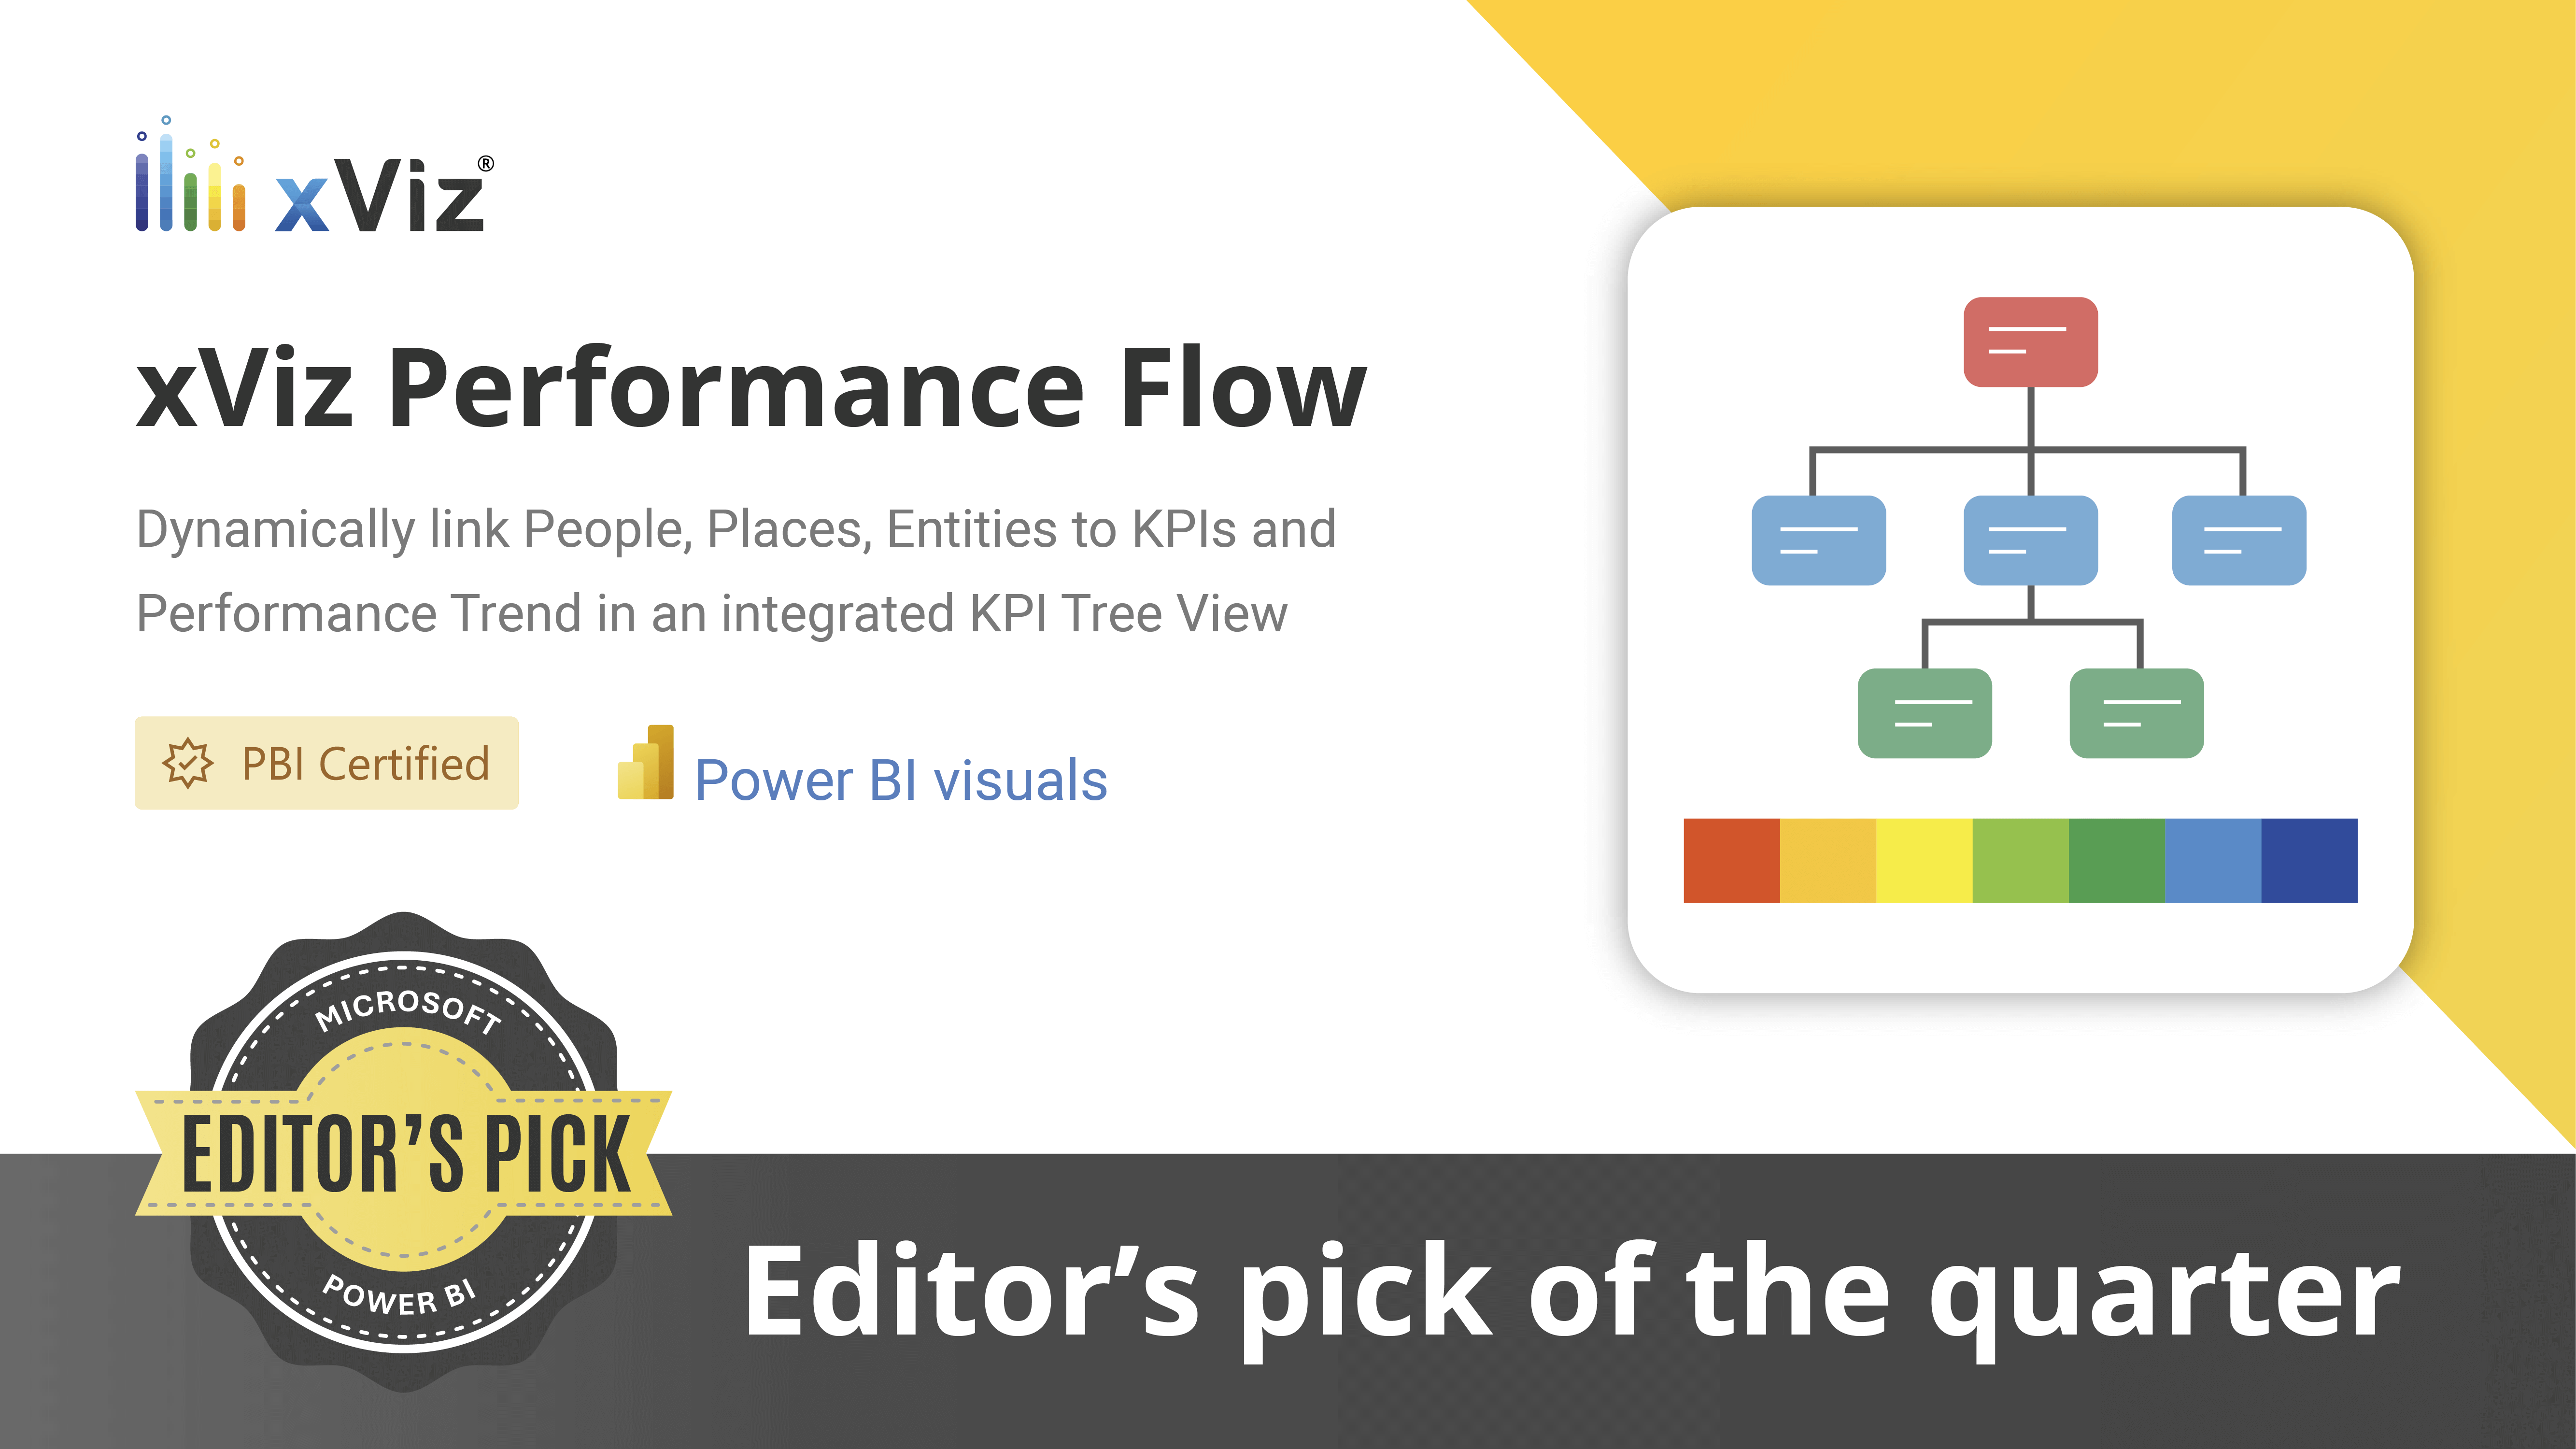
We’re thrilled to share that xViz Performance Flow has been featured as the Editor’s Pick of the Quarter in the Power BI Desktop Summary for August 2024!
What makes this visual stand out?
Explore these impeccable features to make your reports more insightful and actionable:
- Visualise hierarchical structures beyond matrix visuals - Data Structure | xViz
- Data-driven alerting rules with powerful Conditional Formatting across various components - Conditional Formatting | xViz
- Have additional text notes to complete your storytelling experience? Use Notes & Annotation | xViz to accomplish your needs
- Use Links | xViz to visualize beyond the typical hierarchical structure to show dependencies and relationships.
- To simplify complex structures into smaller trees for better viewer understanding, have a look at Viewing Subtrees | xViz.
- Do you want to visualize process flows or supply chains grouped in stages? Check out Swim Lanes | xViz in our visual.
- Trendlines for Performance Analysis - Sparkline Trends | xViz
- Data-driven appearance of the tree cards - Node Appearance | xViz
- 10+ Predefines Templates for tree nodes - Templates | xViz
- Empower report viewers with interactive features like Zooming, Navigation, Ability to change the viewing options, etc.
Versatile Use Cases: The xViz Performance Flow visual is perfect for a wide range of applications, including:
- HR Analytics
- Data Lineage
- Career Maps
- Supply Chain Flows
- Cost Center Performance
…and many more.
Get creative and try this certified visual for free from Microsoft AppSource here.
You can also check out the Power BI Desktop Summary Blog by Jason Himmelstein here.