Free 30-Days trial for xViz visuals here!

xViz Waterfall Chart : Addressing frequently asked features from Power BI Ideas place

Bhupinder Singh Chadha
February 28, 2020

This blog is a part of the Waterfall Blog Series.

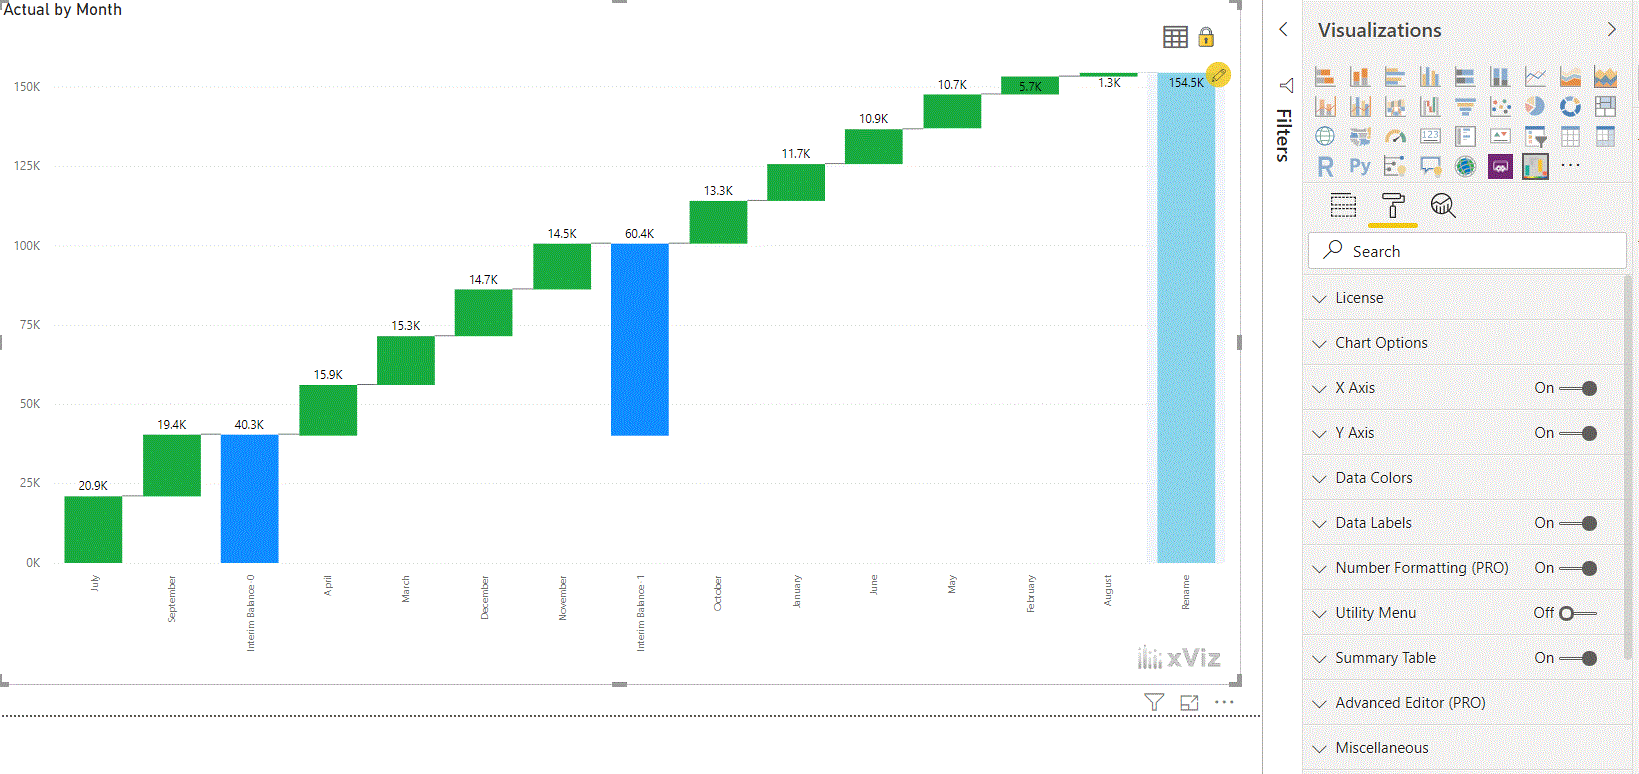
The xViz Waterfall Chart delivers powerful features including the ability to customize interim & final balances, custom sorting, number formatting, and more.

In building this custom visual, we paid keen attention to frequently asked features from the Power BI Ideas site for the waterfall chart. As a result, the xViz waterfall chart can address some of the most commonly requested features as shown below.

You can also download a sample PBIX file of the Waterfall Chart to get an overview of the visual.

Other noteworthy features can be found here.

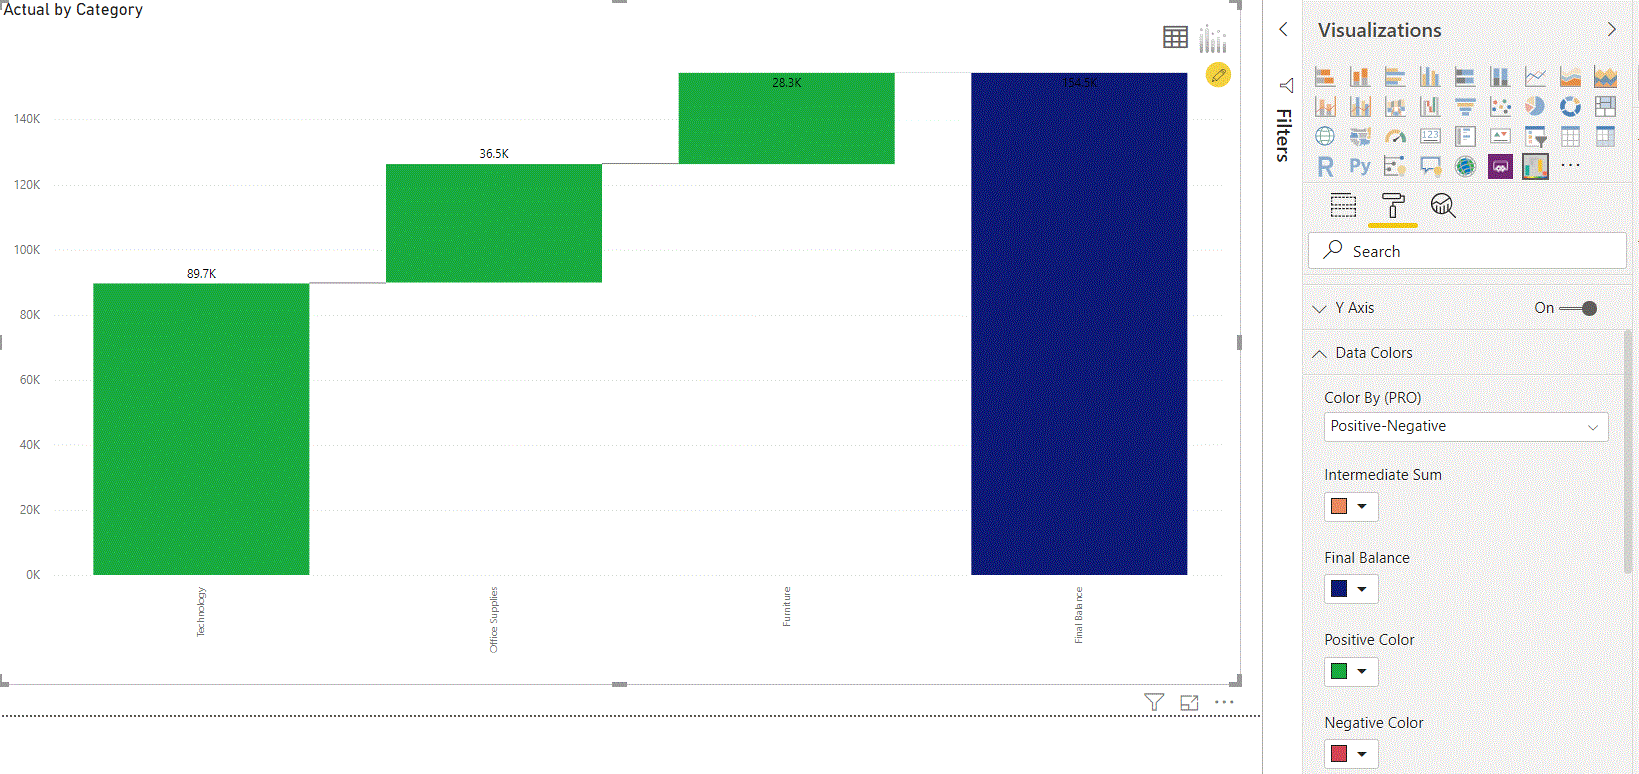
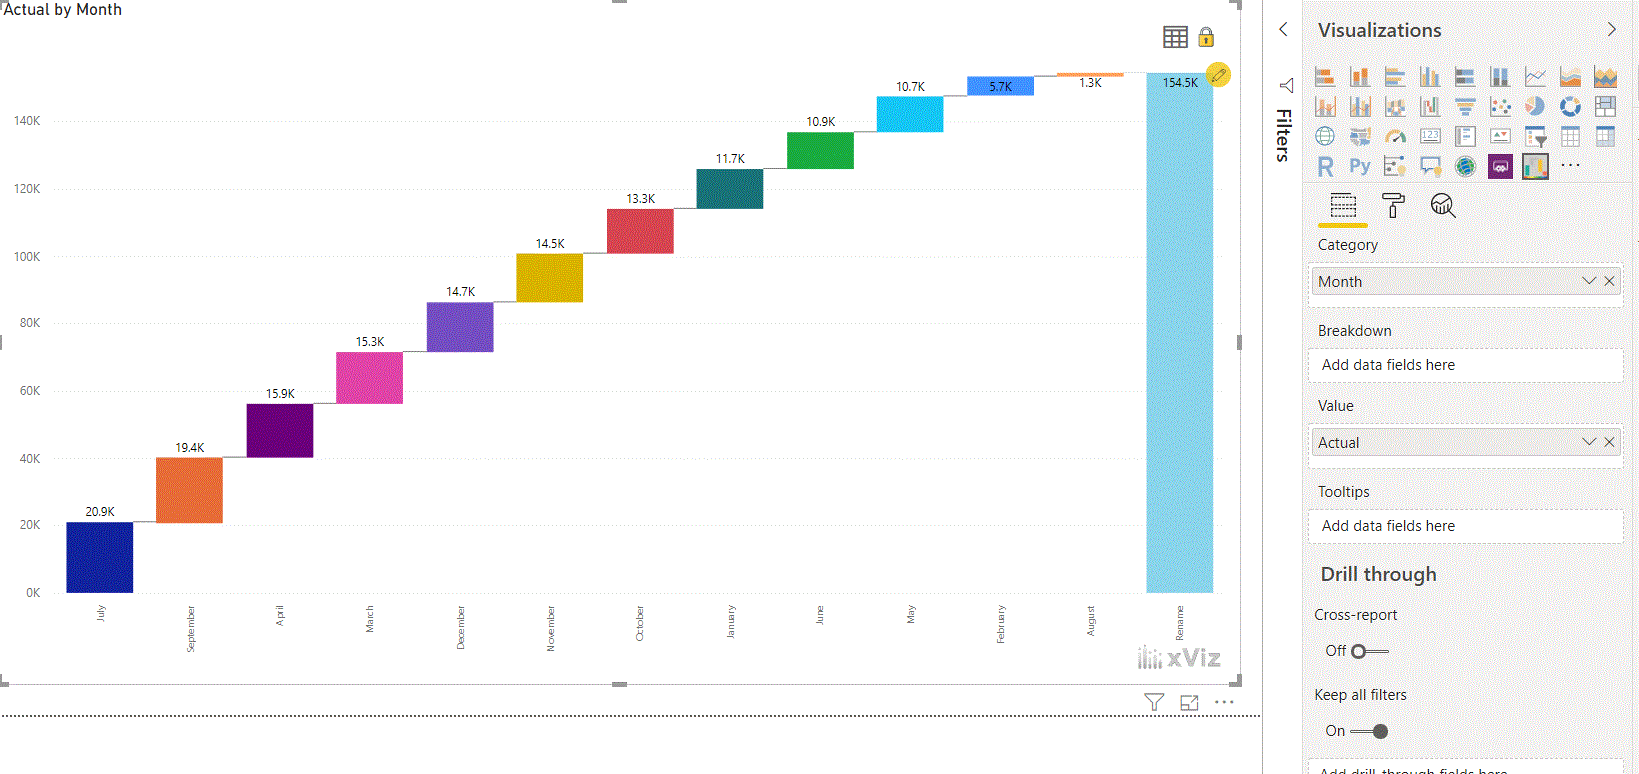
  1. Ability to show, hide & rename totals (700+ votes overall from multiple such requests)
xViz Waterfall Chart : Addressing frequently asked features from Power BI Ideas place

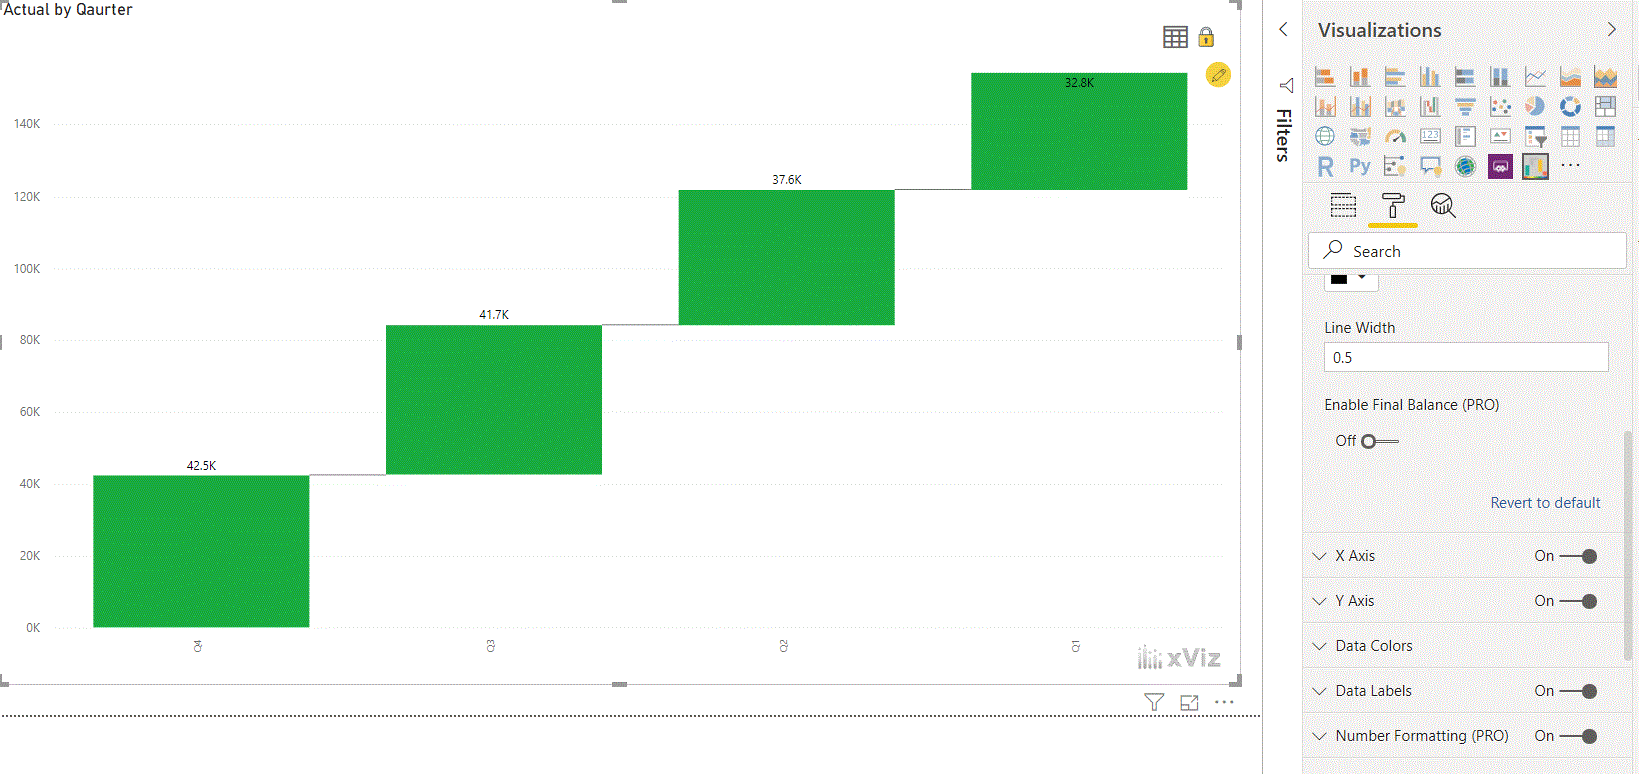
2. Customizing colors for first & last columns (69 votes)

xViz Waterfall Chart : Addressing frequently asked features from Power BI Ideas place

3. Hierarchical drilldown capability for breakdowns (30 votes)

xViz Waterfall Chart : Addressing frequently asked features from Power BI Ideas place

4. Configuring a member as a subtotal (30 votes)

xViz Waterfall Chart : Addressing frequently asked features from Power BI Ideas place

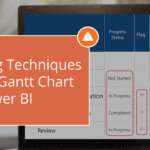
5. Having appropriate start & end values for variance analysis rather than just starting with 0 and showing end value as sum of variances (27 votes)

xViz Waterfall Chart : Addressing frequently asked features from Power BI Ideas place

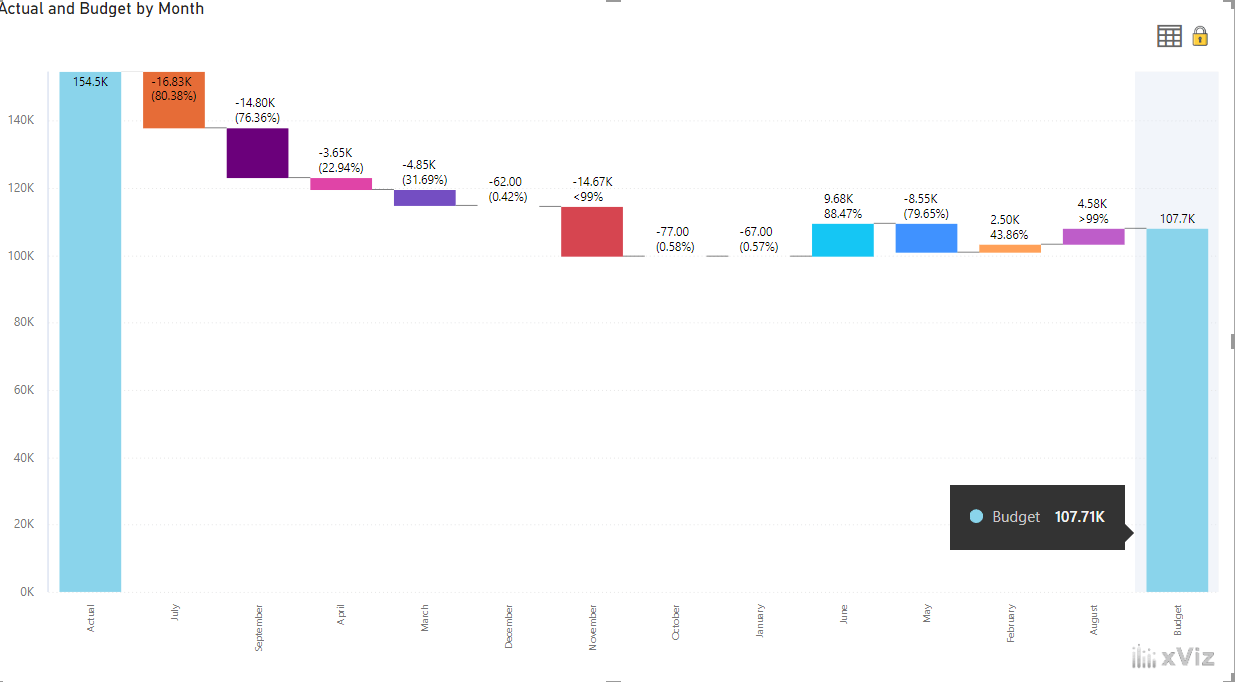
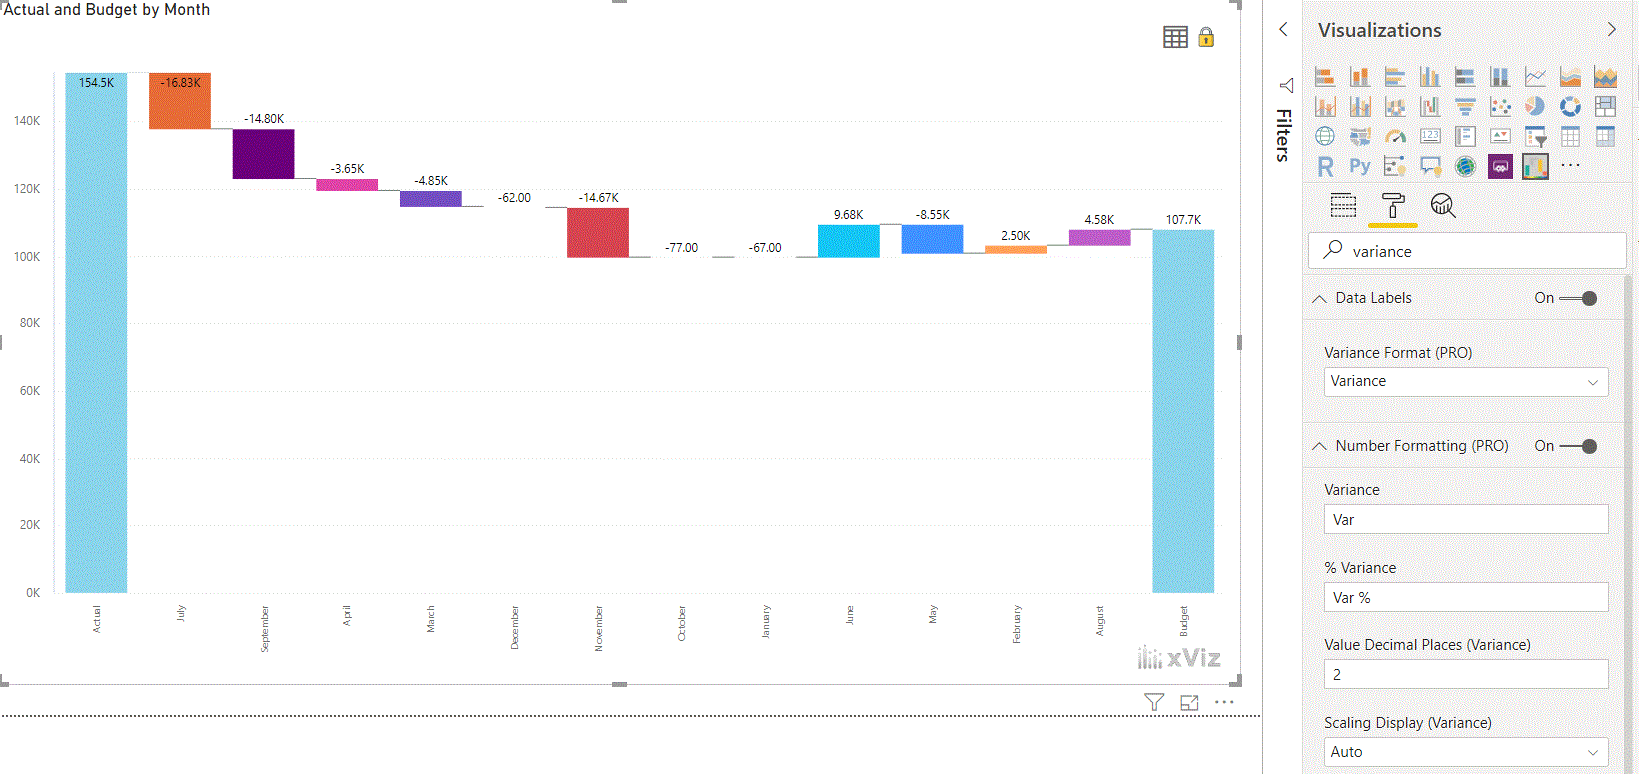
6. Display absolute variance and % variance (12 votes)

xViz Waterfall Chart : Addressing frequently asked features from Power BI Ideas place

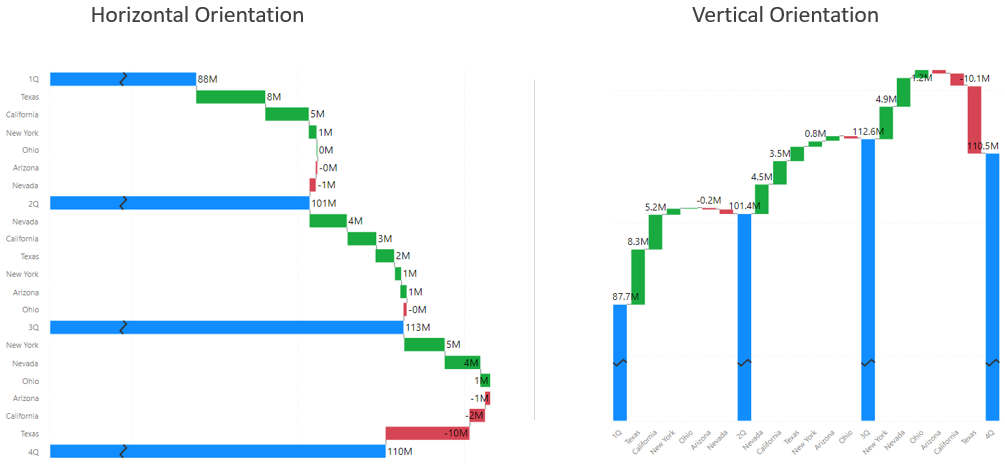
7. Vertical waterfall orientation (11 votes)

xViz Waterfall Chart : Addressing frequently asked features from Power BI Ideas place

8. Convert any intermediate item as a subtotal (14 votes)

xViz Waterfall Chart : Addressing frequently asked features from Power BI Ideas place

There are many more features incorporated, but we have chosen to list the top 8 at this time.

Do you need a feature that you think is missing? Reach out to us here.

You can take a look at the other advanced custom visuals by xViz here

xViz
About xViz!
xViz is a leading provider of advanced enterprise-grade visuals for Microsoft Power BI. The powerful, intuitive, and customizable data visualization experience of xViz, maximizes the potential of the data and elevates analysis to new heights. This product is developed by Lumel Technologies (formerly Visual BI), which has a decade of experience in building add-on solutions on top of BI platforms (SAP BI and Power BI) with our suite of innovative products such as Inforiver, xViz and ValQ.
PBI Certified

Headquarters

5920 Windhaven Pkwy, #130
Plano TX 75093

Inforiver
ValQ
cross linkedin facebook pinterest youtube rss twitter instagram facebook-blank rss-blank linkedin-blank pinterest youtube twitter instagram