

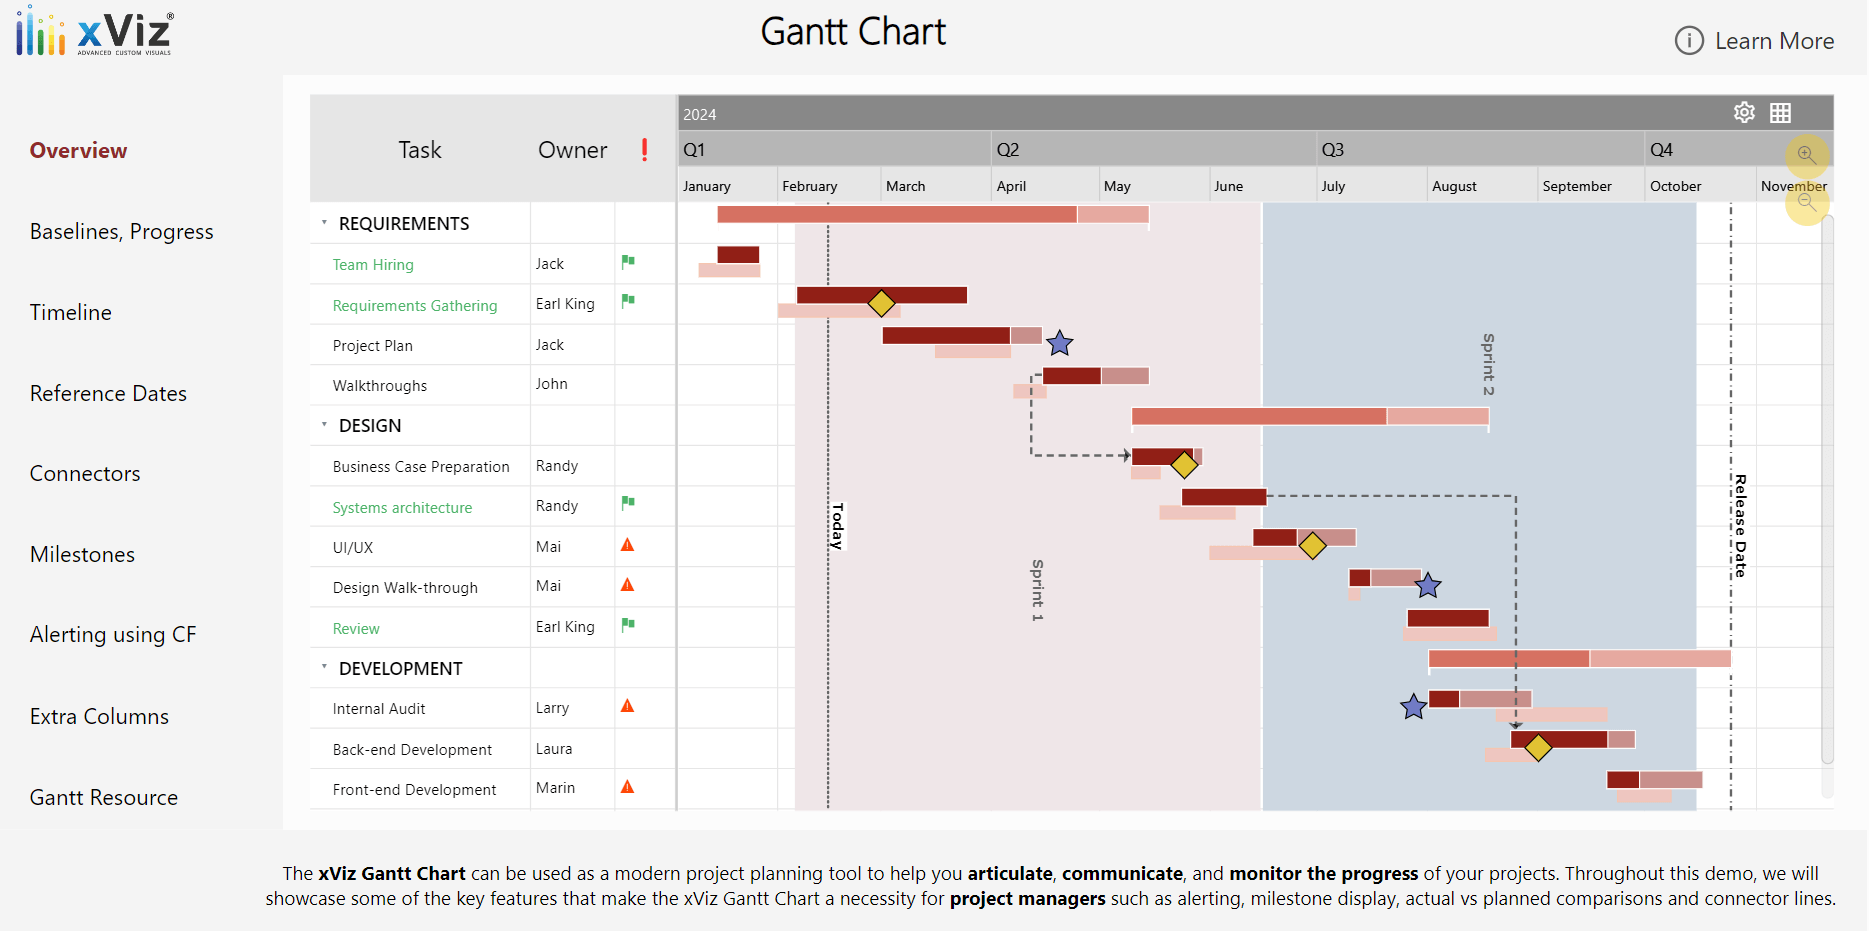
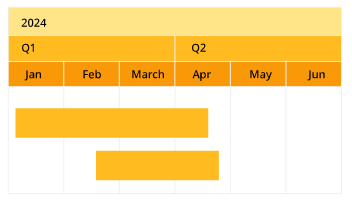
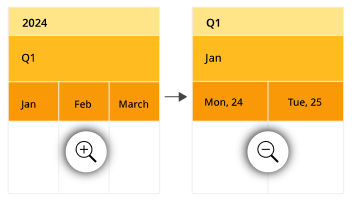
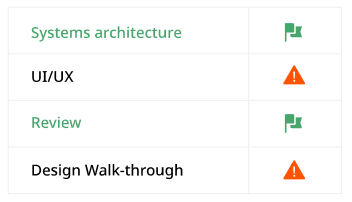
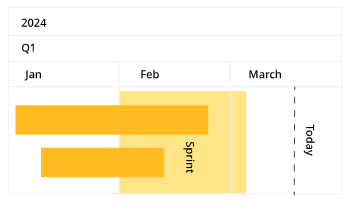
The Gantt Chart for Power BI shows activities (tasks or events) displayed along a given timeline. On the left side of the chart is the Data Grid, which displays lists all the tasks as part of the project or work breakdown the structure to be completed. It is one of the most widely used project planning tools. It helps you visualize your project plan to articulate, communicate, and monitor the progress.


Headquarters
5920 Windhaven Pkwy
Plano TX 75093