
The Gantt Chart for Power BI shows activities (tasks or events) displayed along a given timeline. On the left side of the chart is the Data Grid, which displays lists all the tasks as part of the project or work breakdown the structure to be completed. It is one of the most widely used project planning tools. It helps you visualize your project plan to articulate, communicate, and monitor the progress.
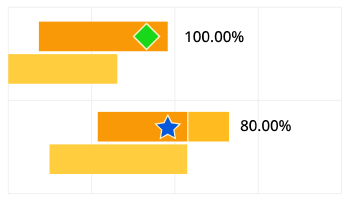
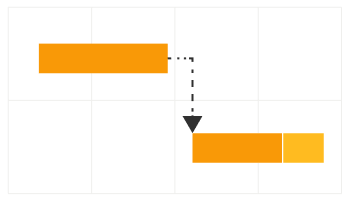
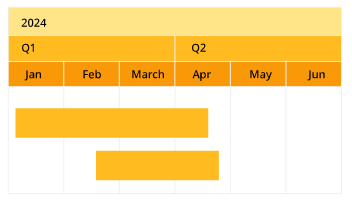
| Features | Power BI Gantt Chart | xViz Gantt Chart Free | xViz Gantt Chart EnterpriseSold separately and is not part of the xViz Pro Suite |
|---|---|---|---|
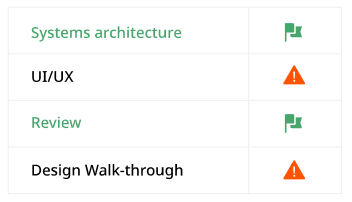
| Conditional Formatting -Progress Bar, Status Flag, Data Grid | Unlimited Rules for Alerting can be Added |
||
| Live Editing | |||
| Additional Chart Options - Gantt Resource | |||
| Fiscal Year | |||
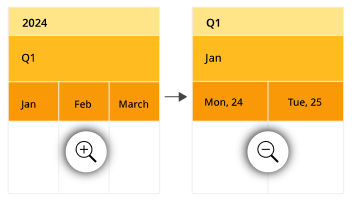
| Zoom Options - Runtime and Design Time | Both Runtime and Design Time Options Available |
||
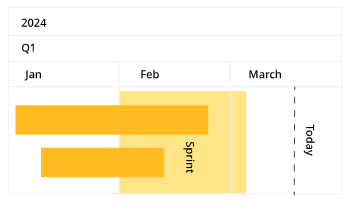
| Reference Line | Unlimited Reference Lines can be Added |
||
| Number Formatting | |||
| Milestone Customization - Shape and Color | |||
| Display Totals | |||
| Filter Blanks | |||
| Root Node Styling | |||
| Web URLs | |||
| Timeline Zoom | |||
| Advanced Editor - Zoom Levels | |||
| Export to Table | |||
| Progress Bar display - Bar/Bullet | |||
| Additional Columns (Categories and Value) | |||
| Data Grid Customization | |||
| Parent Node Customization | |||
| Timeline Customization | |||
| Define Different Timeline Levels | |||
| Data Label Customization | |||
| Data Label based on field | |||
| Summary Table | |||
| Color Customization based on Different Rules | |||
| Alternate row color | |||
| Hover color | |||
| Connector Lines | |||
| Legends for Milestone | |||
| Display Milestone in Parent Node | |||
| Global Font Family | |||
| Today's Date Reference Line and Text | |||
| Get IT FREE | Buy IT |


Headquarters
5920 Windhaven Pkwy
Plano TX 75093