This blog is part of Gantt chart blog series
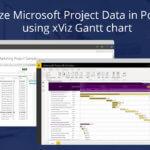
Just like other xViz Suite Custom Visuals, the xViz Gantt chart also provides a robust set of alerting functionalities. There are 3 different types of alerting or visual highlighting in Gantt chart which are as follows:
- Conditional formatting for Timeline (Progress Bar)
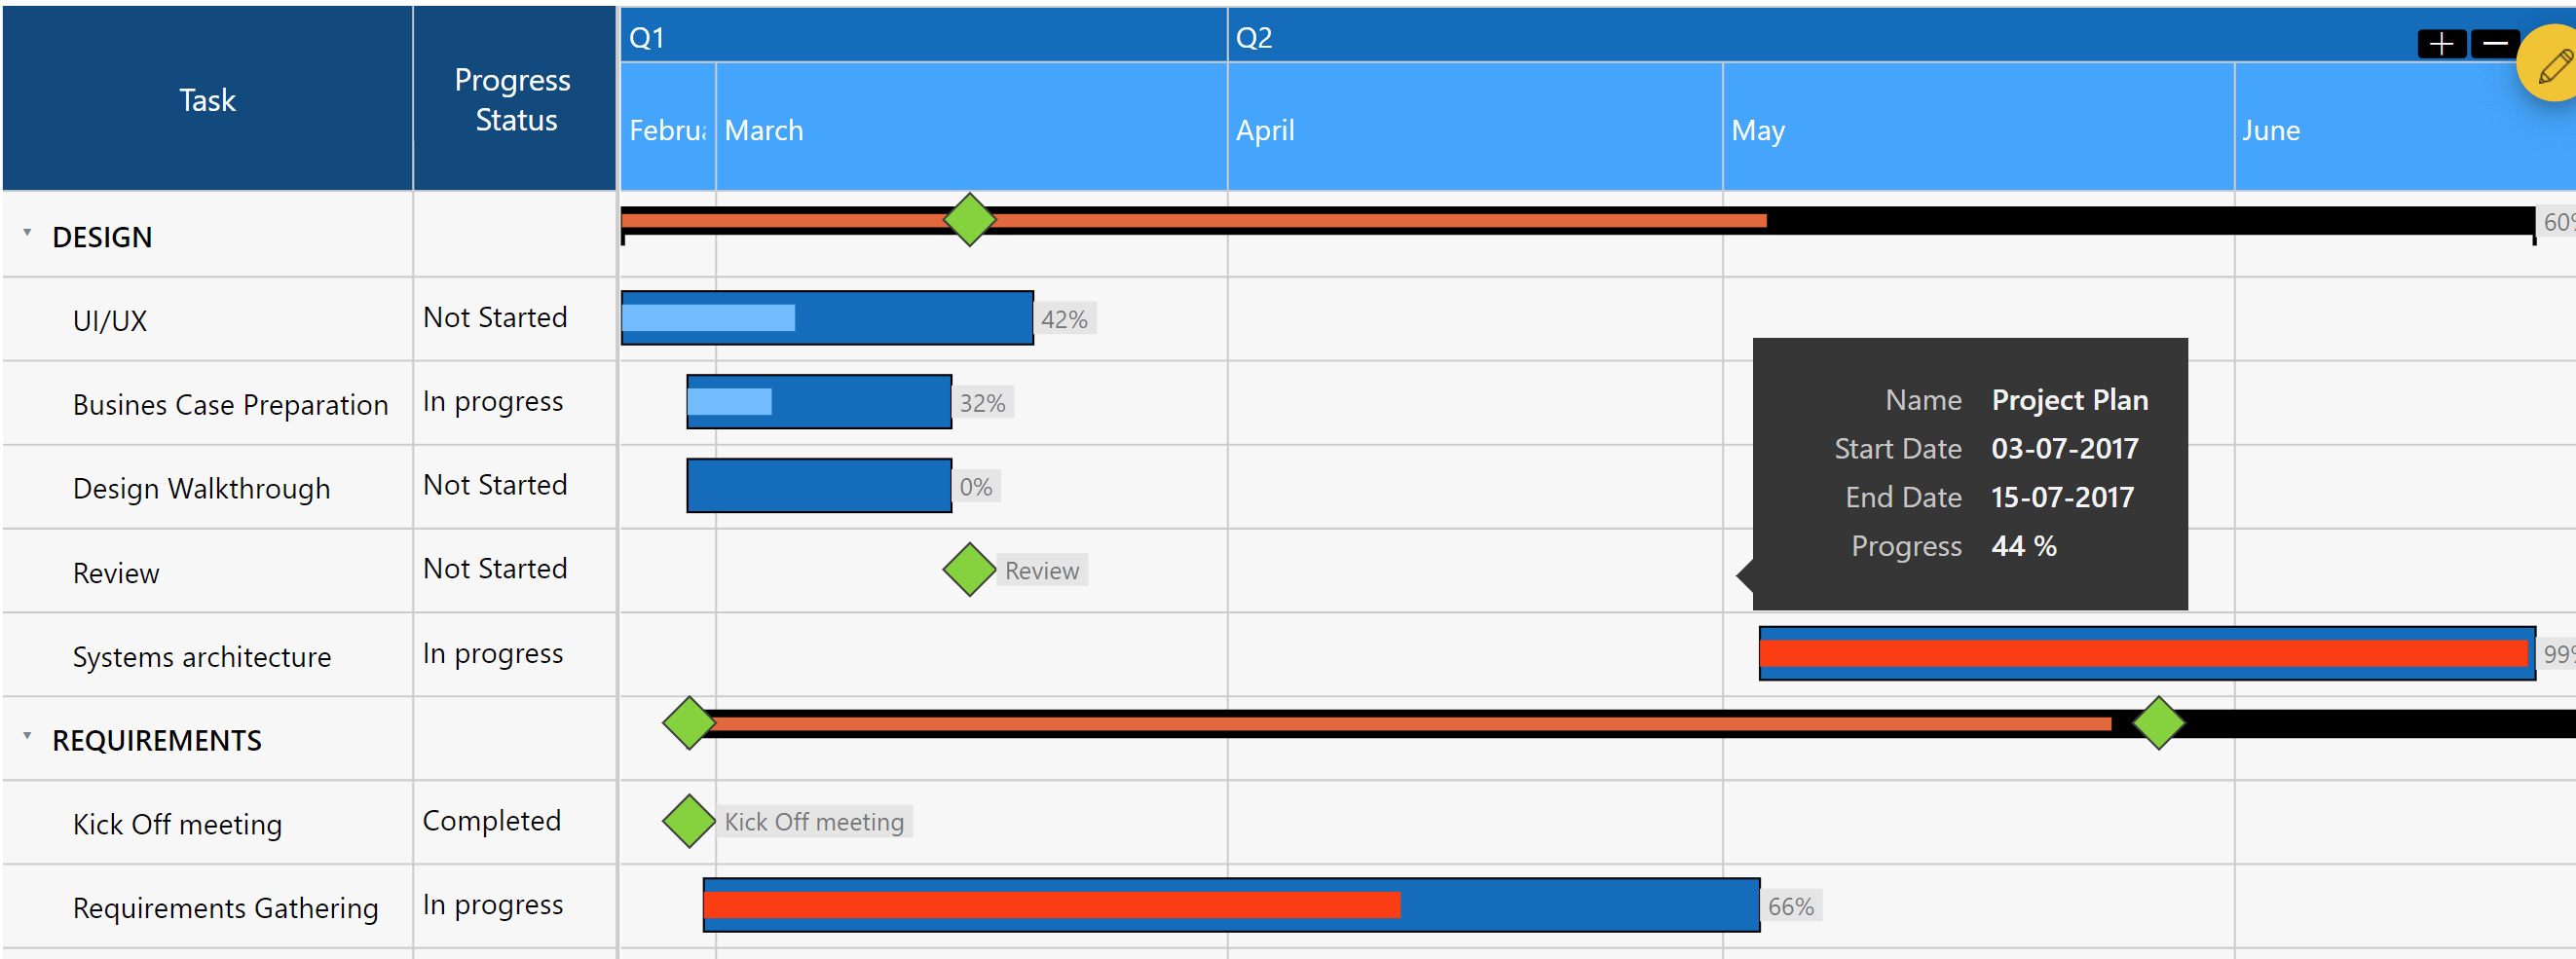
2. Conditional formatting for Data Grid
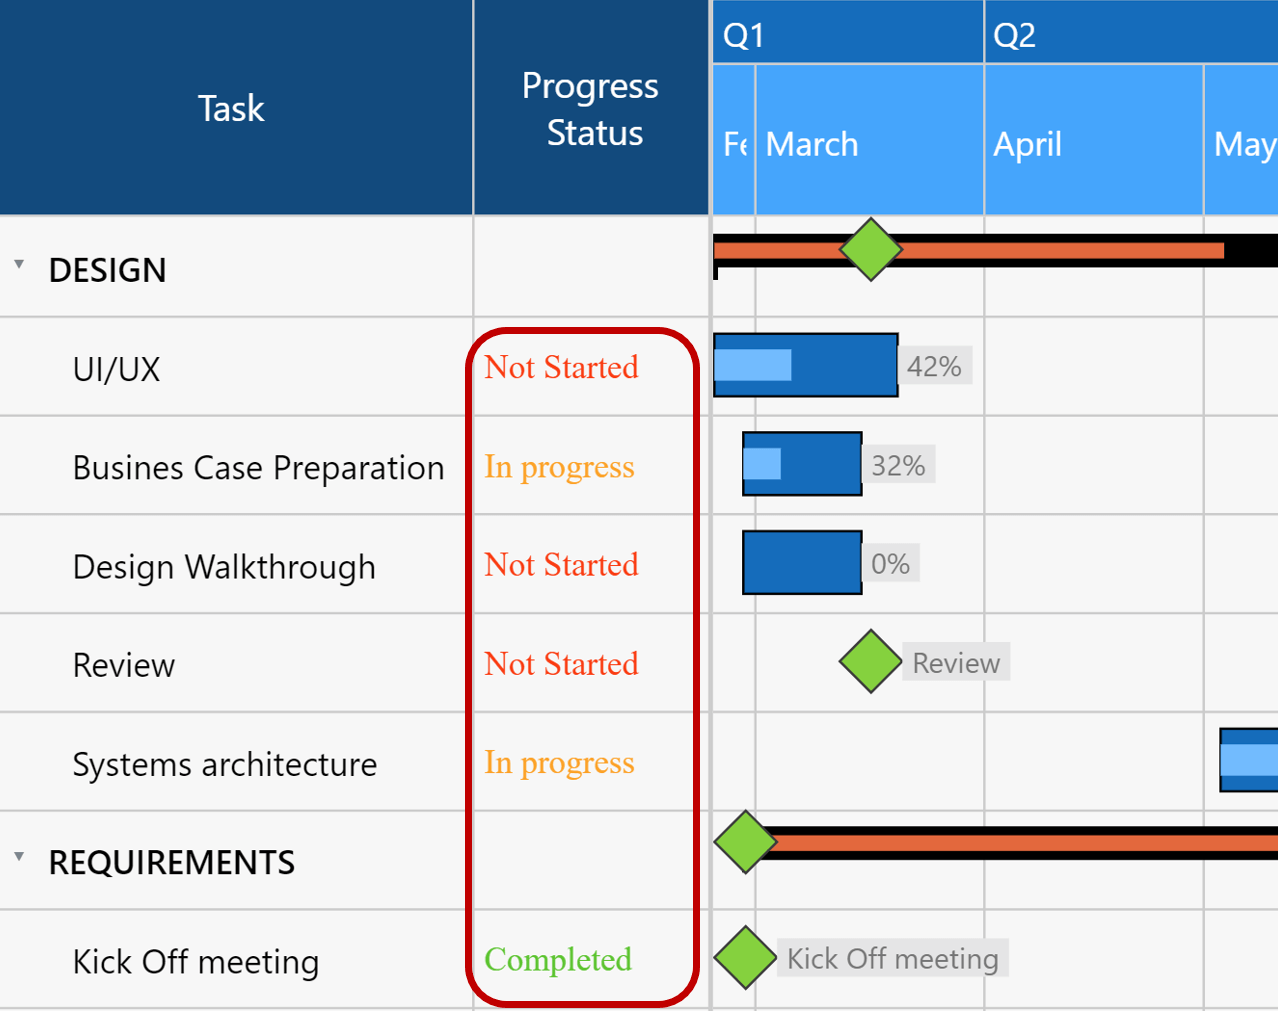
3. Status Flag
All the above alerting techniques make use of common rules or conditions which need to be set up in the advance editor property. So now let’s look at how to set up these rules
5 simple steps to set up the alerting functionality
- Advance Editor- Select the value
Select the value for which you would like to set up a rule and click the plus sign to start adding the rules. You can set up 1 or more rules for each measure. Assign a color and name to the rule.
2. Select the value for the rule to be based on
The rule can either be based on a category field or a value assigned to the chart.
3. Choose an operator
Greater than, Less than …
4. Select the comparison type field
There are 4 different options to choose from:
- Number: Compared against a fixed number
- Data Selection: Compare against a data value assigned to the chart
- Value: Compare 2 values e.g. you could compare Actual vs Planned duration
- Calculation: Create a Calculated Value

5. Select an Alerting option
Once the rules are setup you can choose between the following options
- Progress value
- Status Flag
- Data grid
- Select multiple altering options together e.g. Progress value + Status Flag+ Data Grid
In the next blog, we will be looking at different ways and use cases to setup Milestone in xViz Gantt chart. So Stay tuned!
***
To get the latest version of the custom visual, reach out to us here.
You can take a look at the other advanced custom visuals by xViz here.