This blog is a part of the Gantt Chart Blog Series.
Microsoft Project is one of the most popular project management tools to allow project managers, controllers and team members to plan schedules, track the progress of each task and allocate resources as needed to deliver a successful project.
You may have already used it as a standalone client such as Project Professional on your desktop and have been able to manage your project offline. You can also connect it to Project Online in your Office 365 environment to share this project plan with your Project Online users to collaborate better.
To connect the desktop client project plan to Project Online in Office 365, you would need to subscribe to Microsoft’s cloud-based Project Plan 3 (formerly Project Online Professional) or Project Plan 5 (formerly Project Online Premium). Project Online is built on the SharePoint platform and stores data in the SharePoint data storage.
The project plan in Project Online can be consumed in Power BI by business users to monitor the progress along with other reports. This blog will guide you on how to connect your local project plan to Project Online in Office 365 environment and visualize in Power BI using the xViz Gantt Chart.
- Upload a project plan from Microsoft Project Professional to Project Online
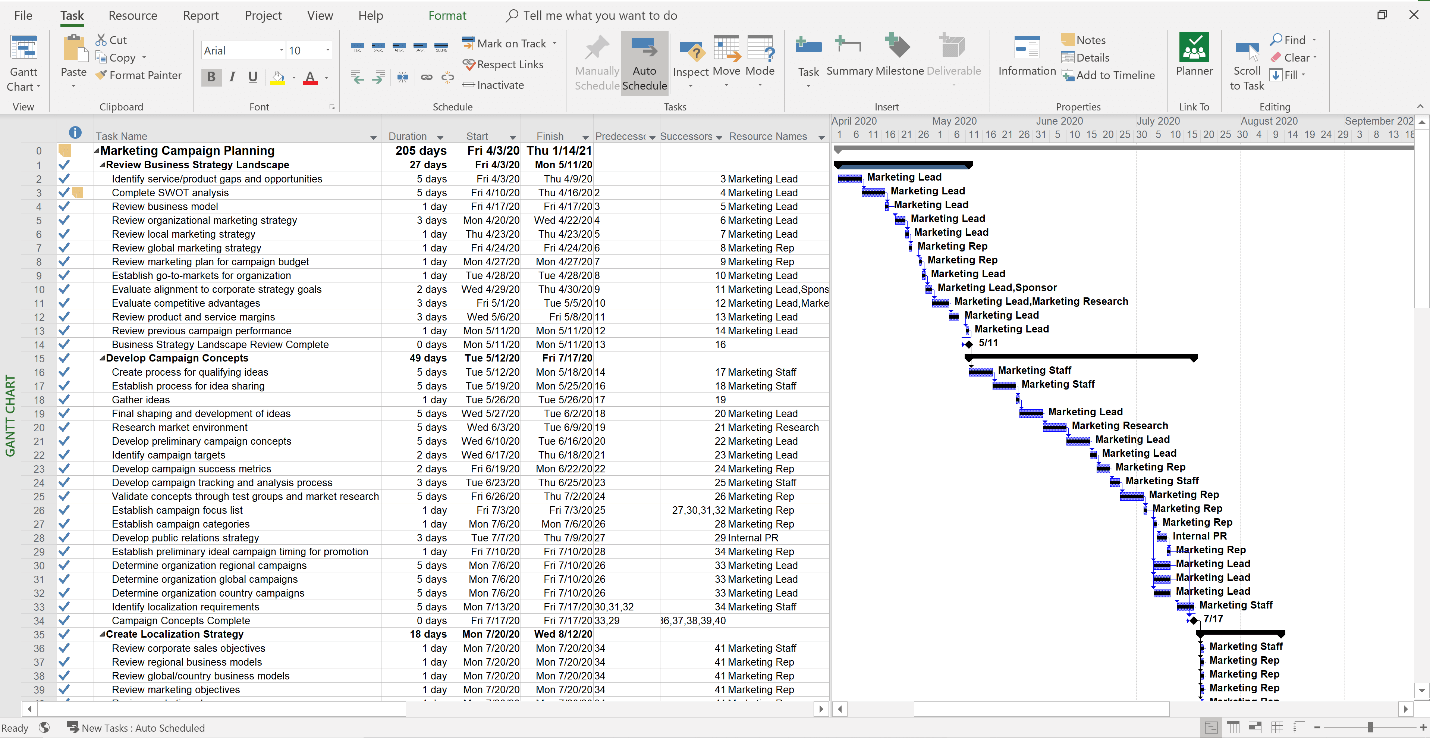
Below is a snapshot of the sample marketing campaign in Project Professional. (Download link for Sample here). This blog shows an example of connecting standalone Project Professional to Project Online; however, Project Online Plan 3 or 5 provides desktop client in the package so that first-time users can use it as a standalone application and create a project plan offline.
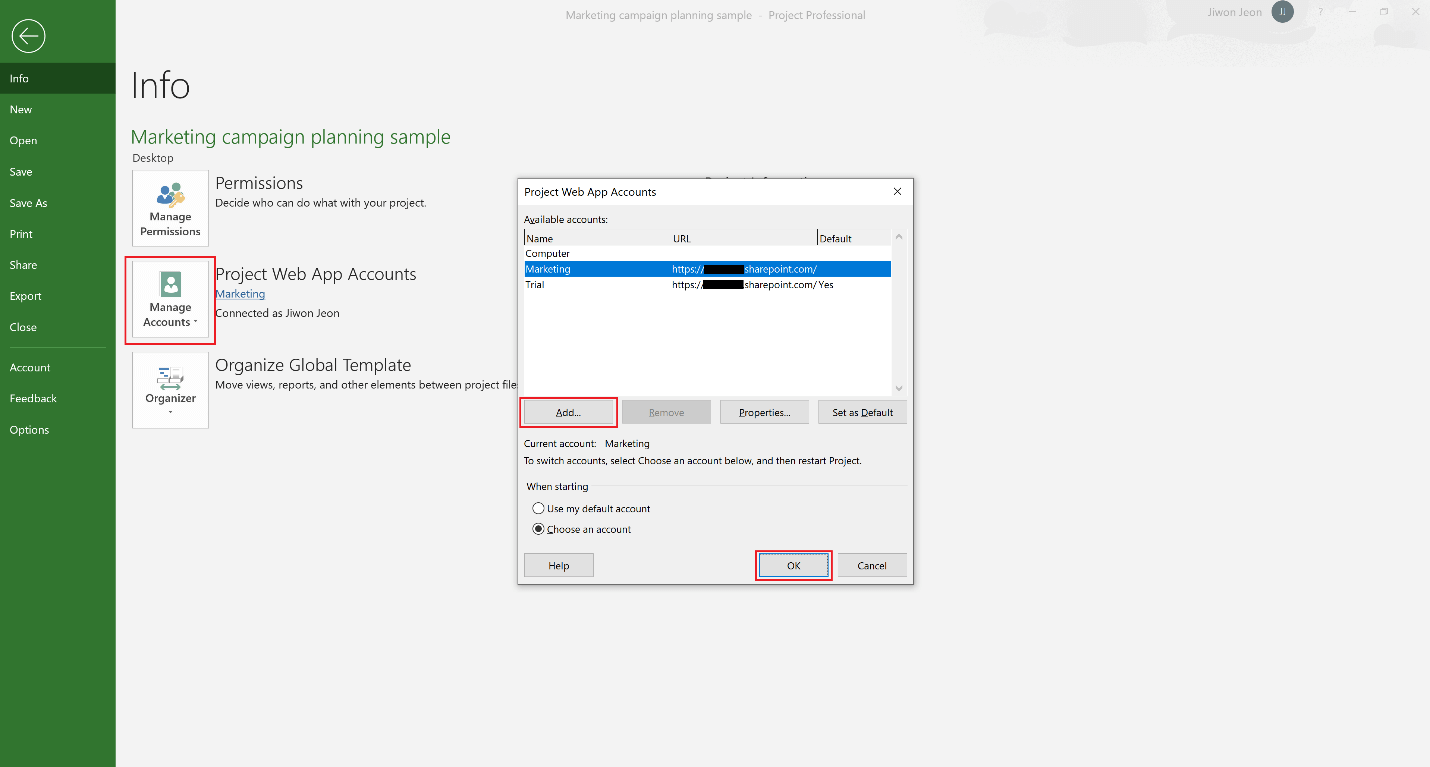
The first step is to configure the Project Web App Account. Before you connect your desktop project plan, make sure that your Project Online Account is created.
Step 1. Click Info and open Manage Accounts.
Step 2. Click Add and name your Account and input Project Server URL. The URL is the address of the Project Online website in the Office365 environment that displays your project. If you connect to your organization’s default Project Online site, the URL would be similar to https://your-organization-sharepoint-name.sharepoint.com/sites/pwa/default.aspx.
Step 3. Click OK. Your project plan is now configured to the Project Web App Account.
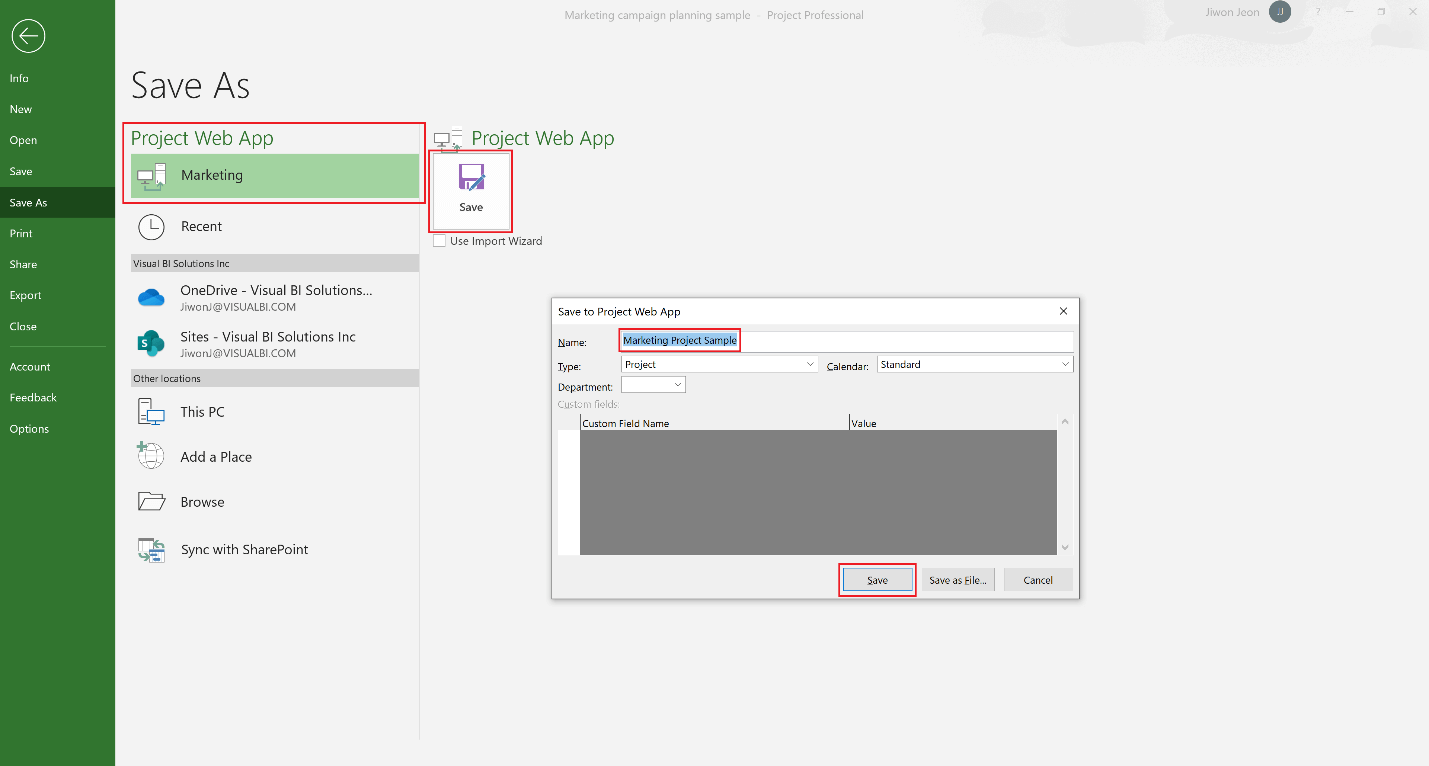
Step 4. Save the project plan file (mpp. format) to the connected Project Web App Account. Click Save As and select the Project Web Account that is configured in the previous step.
Step 5. Click Save and name the project plan to be displayed on the Project Online website. Then hit the Save button.
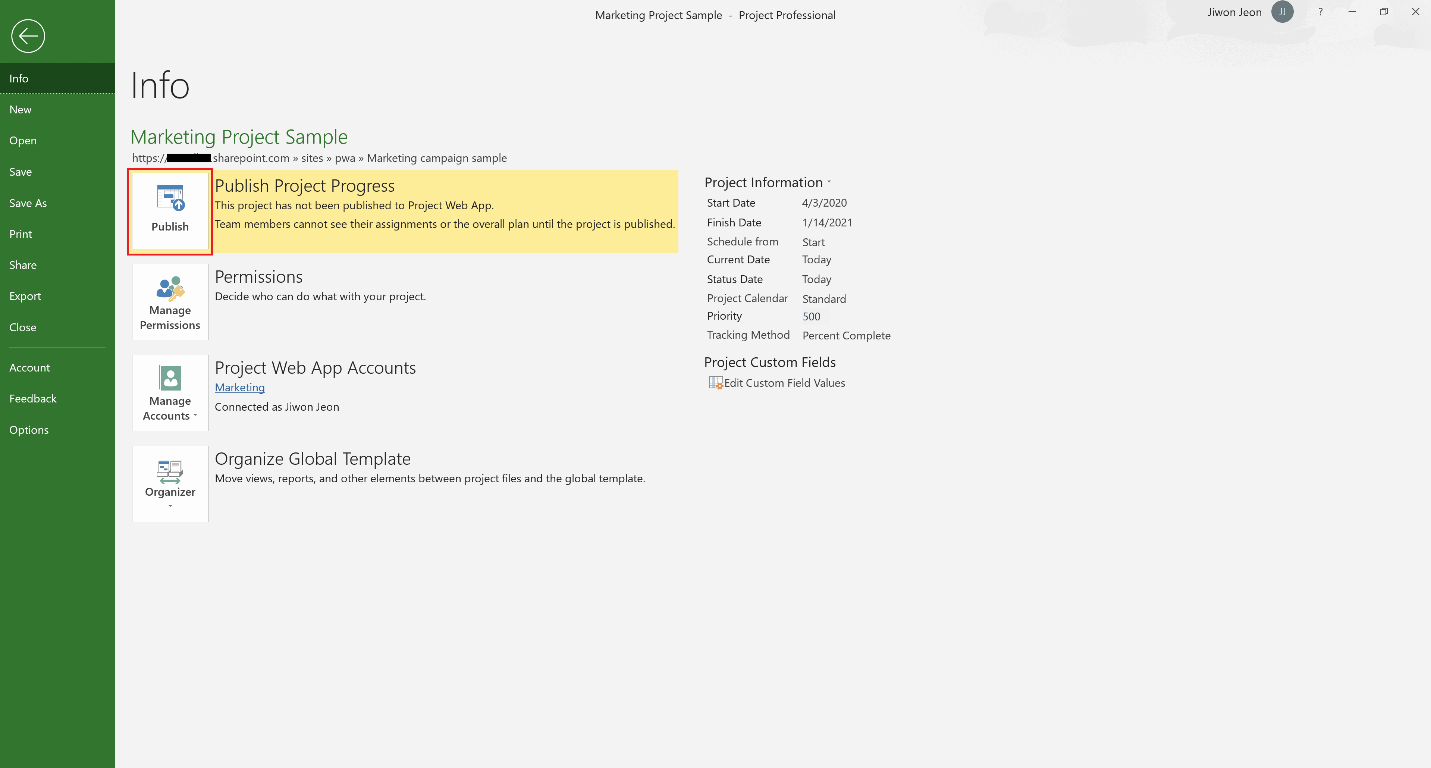
You’re almost done. The last step is to publish the project plan to the cloud.
Step 6. Click Info again. Now you will be able to see the Publish button. Click Publish Project Progress so that the project plan can be uploaded to Project Online using the Project Web App Account.
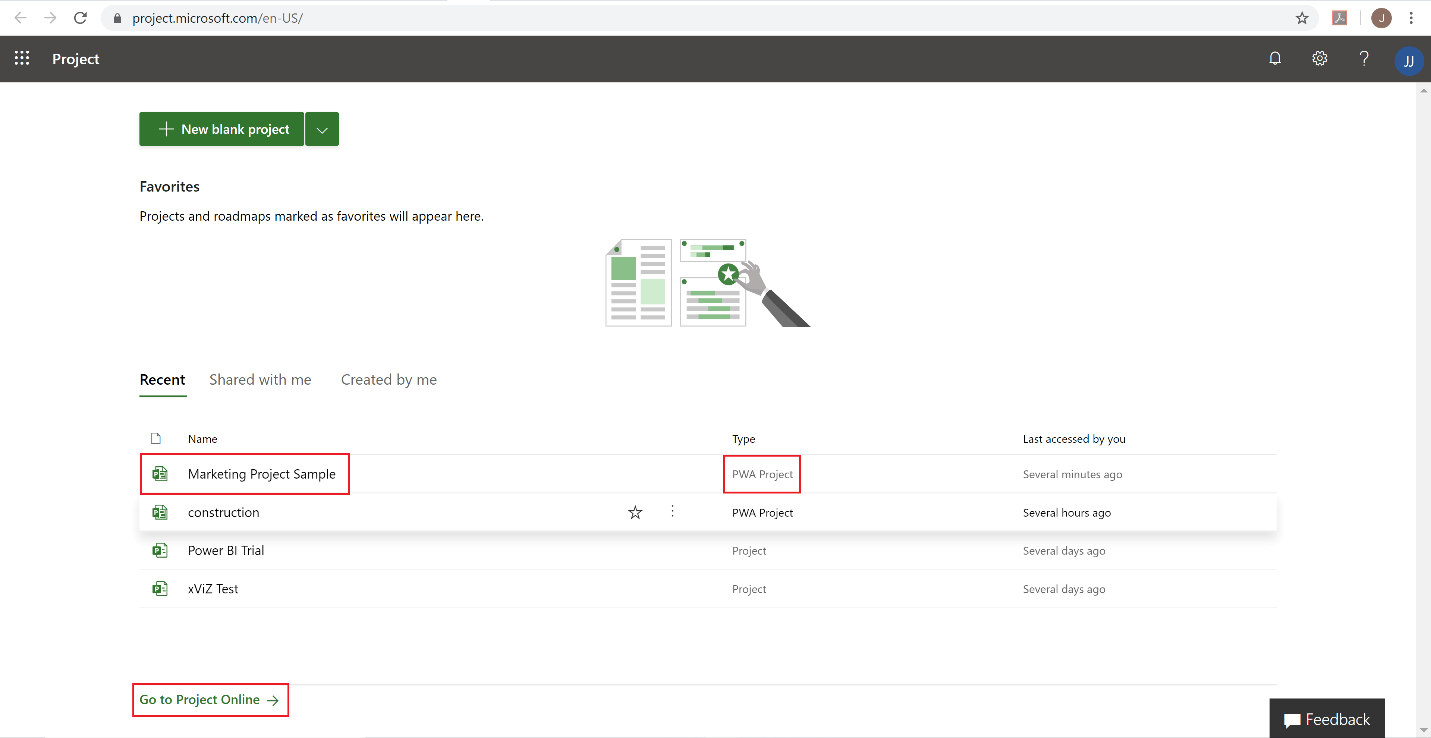
When logging in to your Project Online, you will be able to see on the Recent project list that your project plan is published from desktop to your online workspace as PWA Project type. You will also be able to search the project from the Project Center by clicking Go to Project Online button.
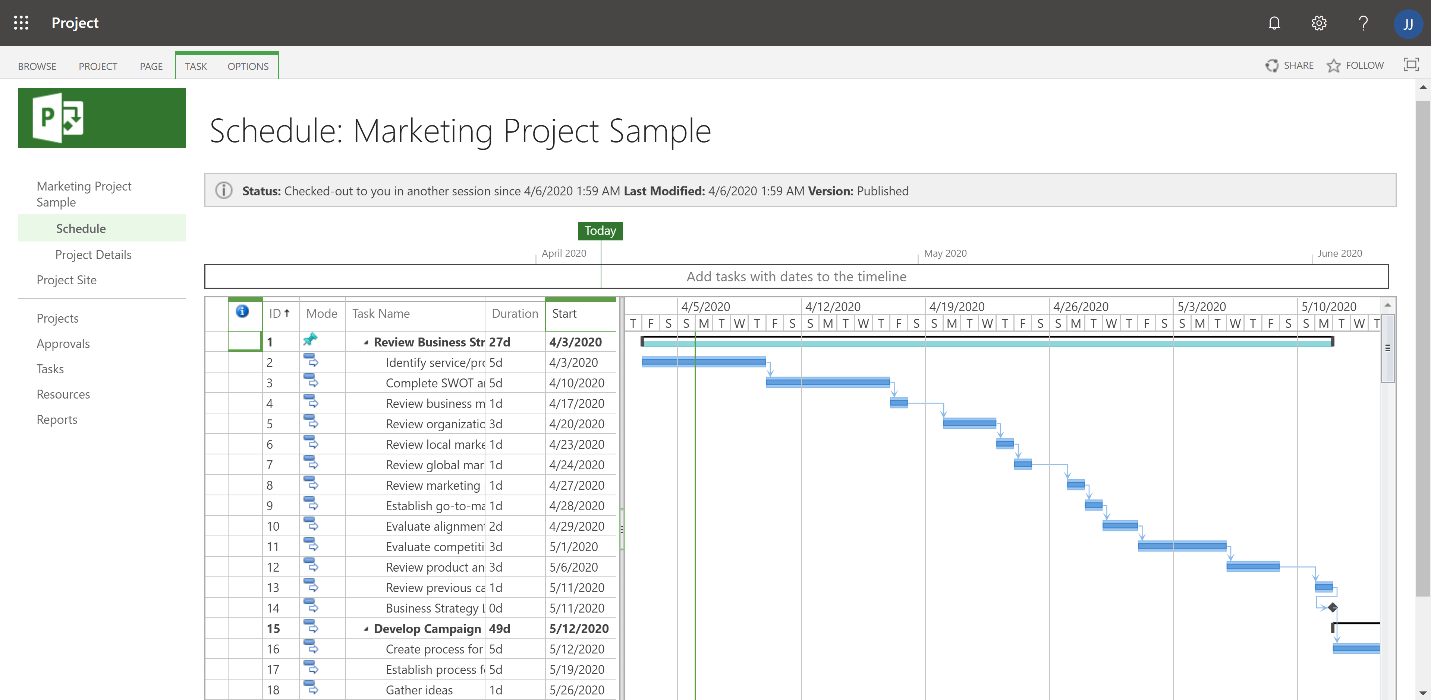
Now, let’s see if the project is shared in the Project Online workspace. Click the project name on the Recent list or from the Project Center.
We can see that the details are well linked to Project Online and editing is available after checking in the project plan from the desktop client. Now your team can monitor and edit the schedule from this Project Online workspace and also share any real-time changes with other members.
2. Connect Project Plan in Microsoft Project Online to Power BI
Currently Power BI does not support direct connection to individual projects in the Project Online as it only brings metadata of each project and shows the overall program progress. So we used the OData connector from Power BI to bring the specific project tasks and mapped them to the xViz Gantt chart for easy campaign monitoring.
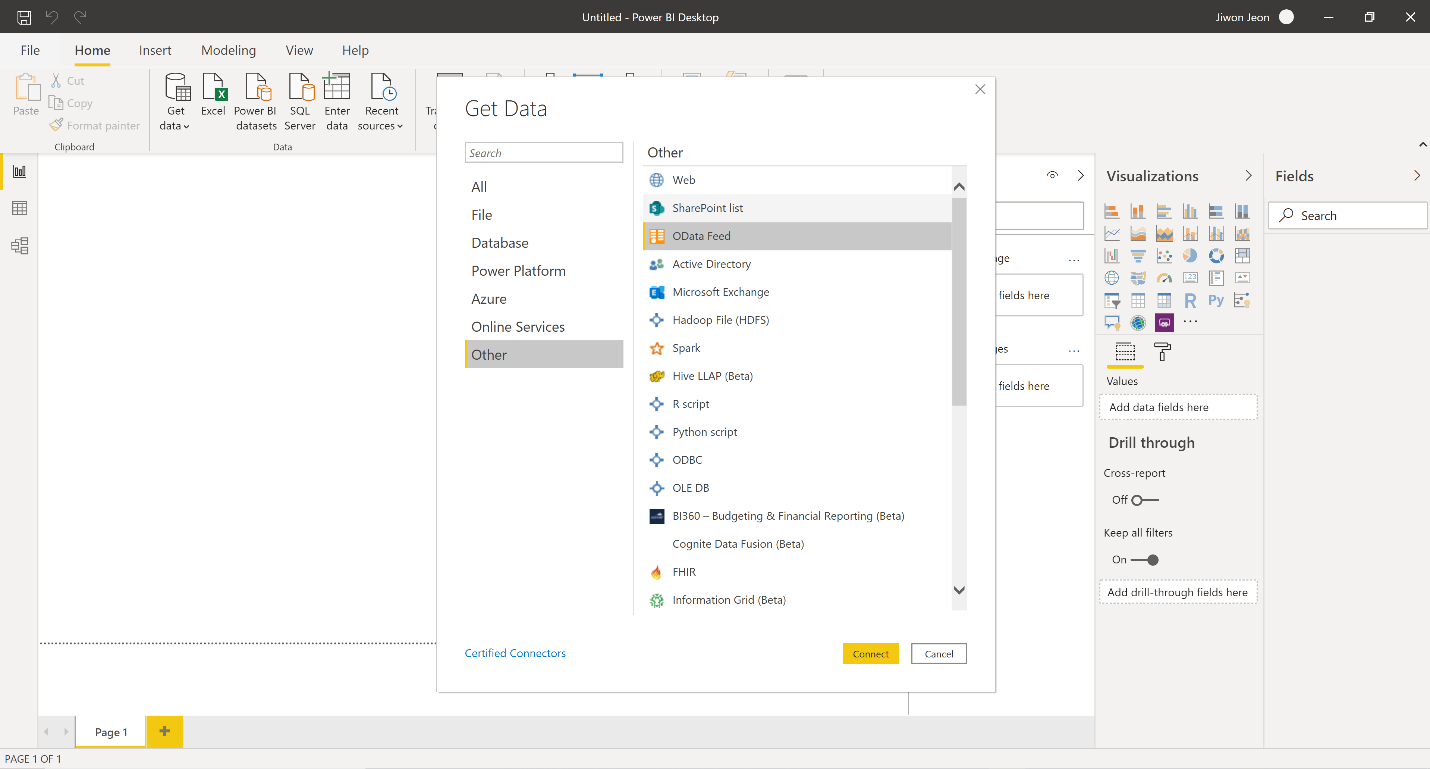
Step 1. Navigate to the OData Feed connector within Power BI.
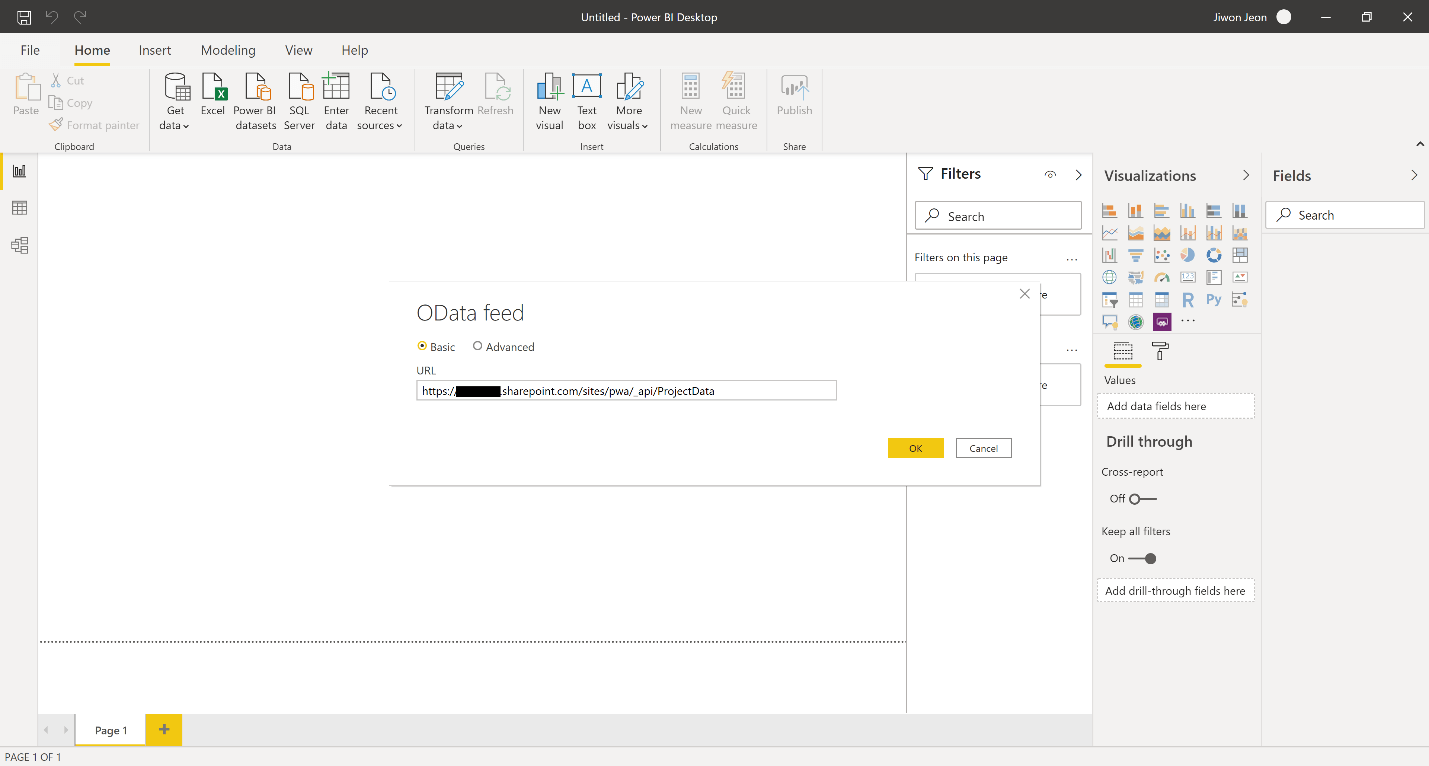
Step 2. Give the URL for OData of your Project Online. It would be similar to the format of https://your-organization-sharepoint-name.sharepoint.com/sites/pwa/_api/ProjectData. If it’s your first time logging in to Power BI, it will ask you to select an authentication method. Choose Auth2 to secure your workspace within Office 365.
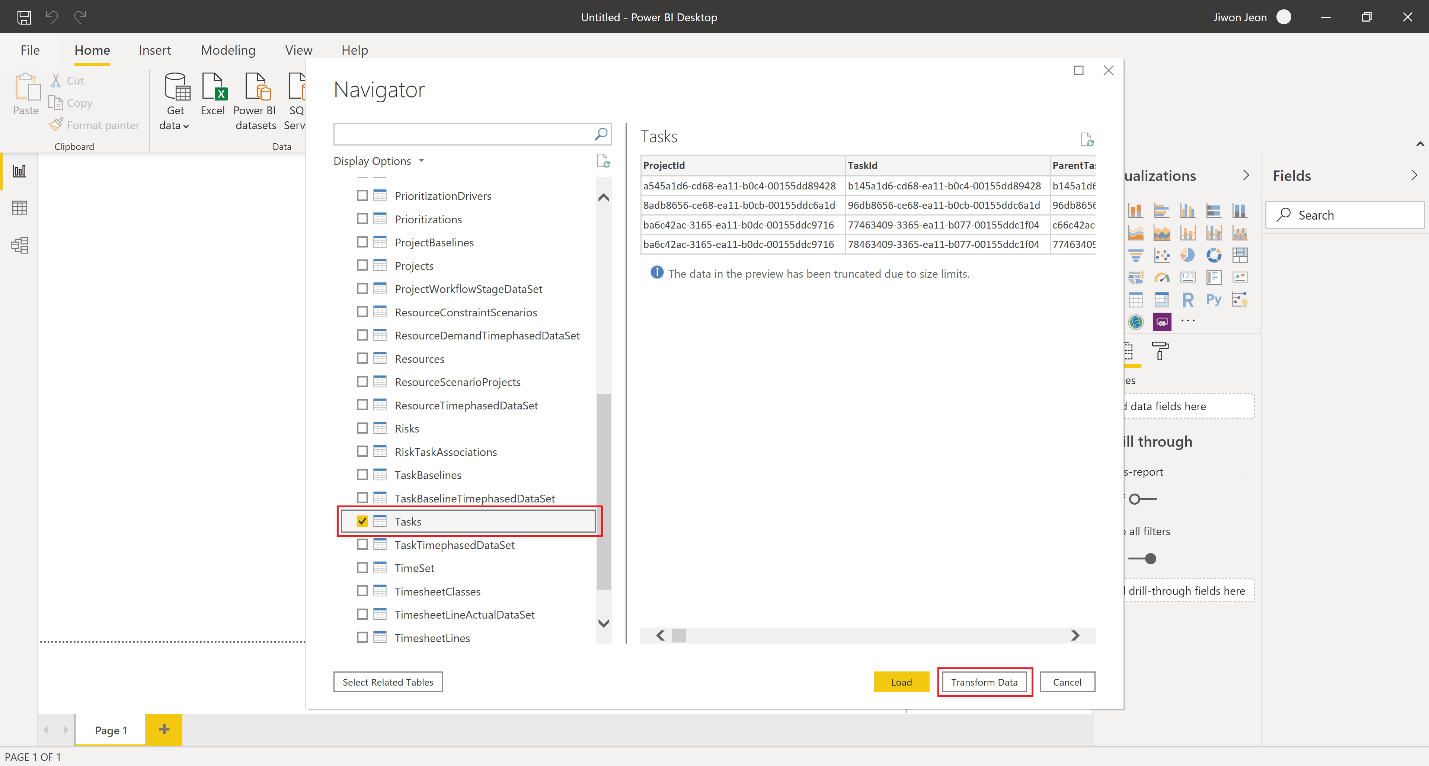
Step 3. Select Tasks and Transform Data to filter the tasks related only to a specific project plan.
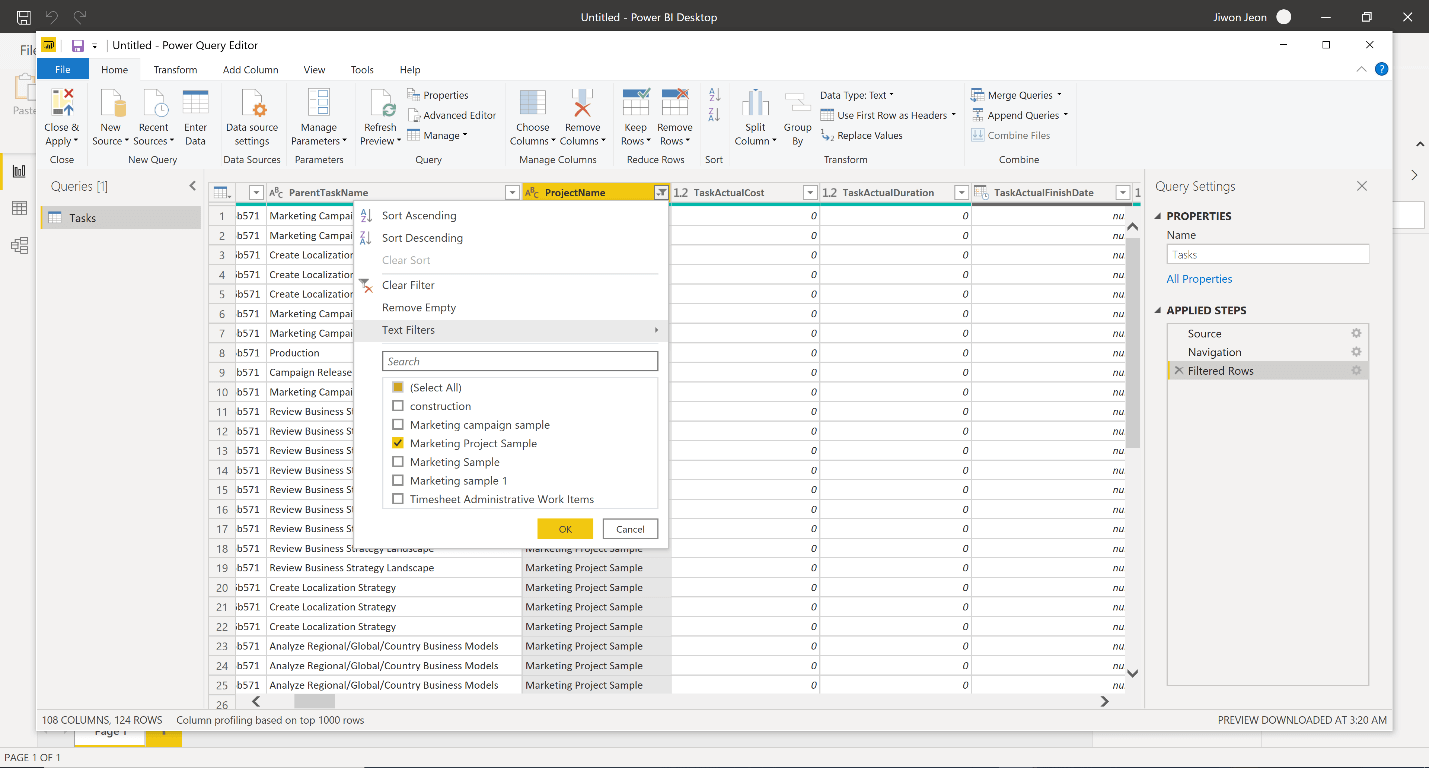
Step 4. Filter tasks by selecting the project under ProjectName column and Close & Apply the query.
Boom! The project data is now linked to your Power BI Desktop. If you want to add more datasets to the project status (for example, expected risks on each task, resource information engaged in the project, etc.), you can map the relationships between the datasets within Power BI and enrich the project planning.
3. Visualize using xViz Gantt Chart
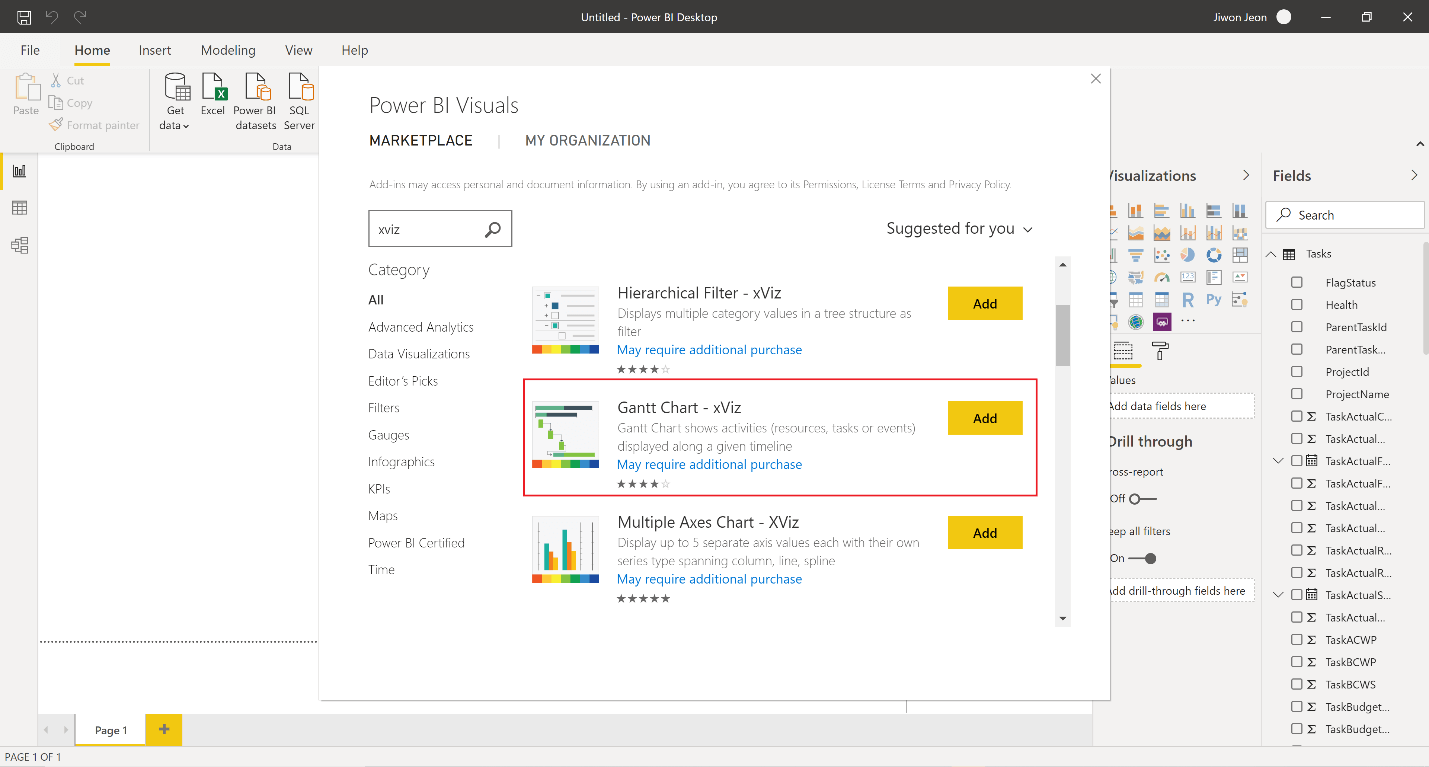
Now let’s integrate this data into our report by visualizing our project plan using xViz Gantt Chart. You can import the xViz Gantt Chart from the Market Place or download the latest version from here.
Drag the respective fields – Task name, Task start, and finish date, etc. – and connect them to the chart. xViz Gantt chart can display the progress of each task in percentage. In this sample marketing campaign, the progress is calculated based on the actual task duration over the planned duration.
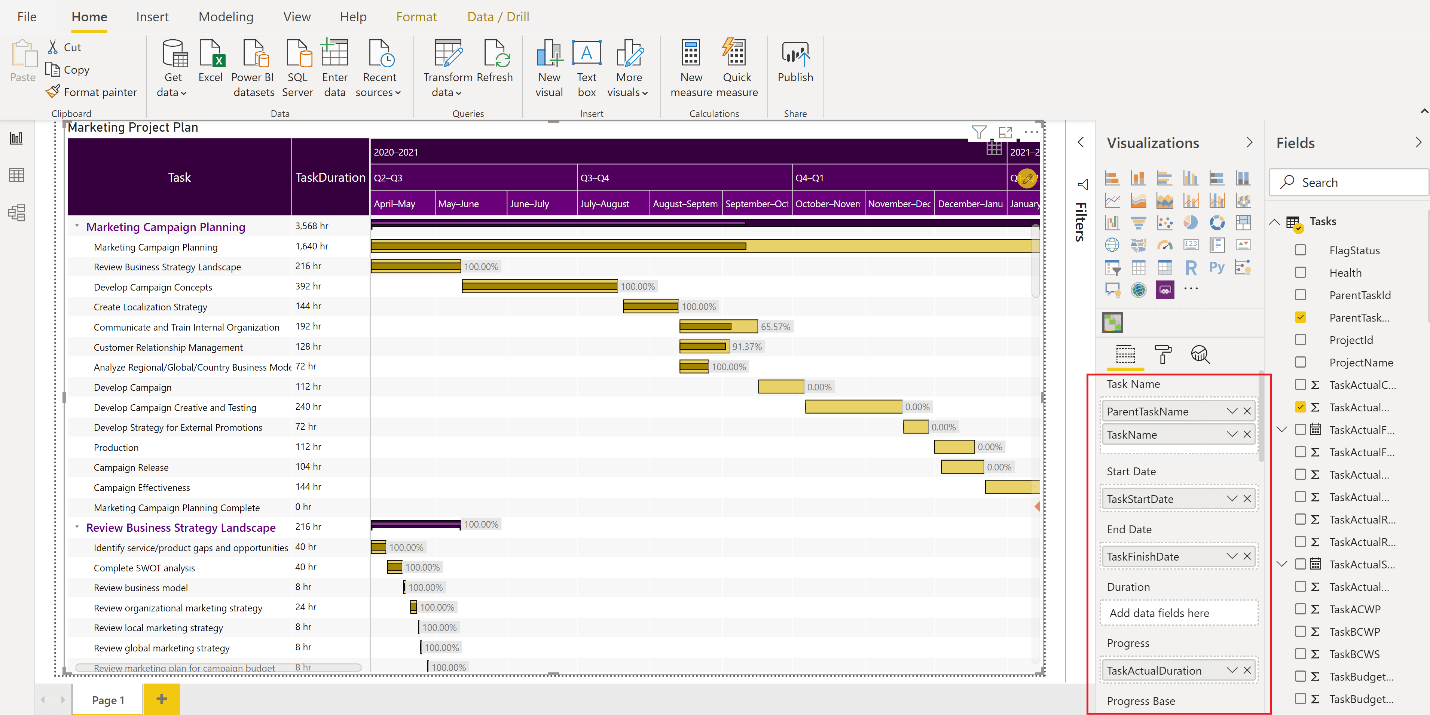
- Voila! We are finally able to visualize our Microsoft Project data in Power BI. You can refer to this step-by-step guide to set up your own Gantt chart.