The October Edition of Power BI Desktop Summary highlights the latest feature updates to the PBI Certified xViz Bullet Chart.
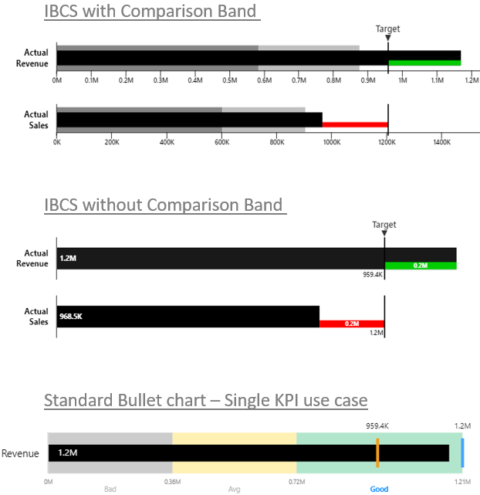
The latest version supports several use cases such as single KPI as well as the IBCS improvements to the bullet chart for effective visualization. It is achieved by highlighting the variances between actual and target with the help of variance bar and normalizing target values to facilitate visual evaluation.
Key Feature Additions:
- IBCS bullet chart use case – with and without comparison band
- 8 Prebuilt Bullet chart Templates
- Variance Bar
- Single KPI use case with band names
- Ranking
- Sorting on Variances
- Analytics section
- Target and Comparison of band enhancements
- Data label enhancements
Read about all the latest updates to the visual here!

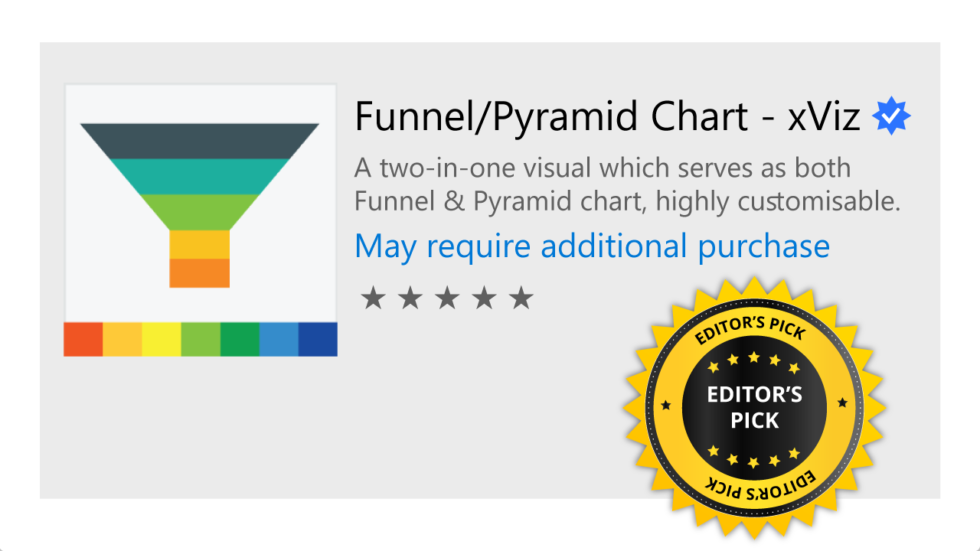
We are also thrilled to announce Funnel/Pyramid Visual from the xViz Pro Suite is highlighted as the “Editor’s Pick” for the month of October. You can try it out here with all pro features unlocked for Power BI Desktop!

You can also check out the Power BI Desktop Summary Blog by Jeroen ter Heerdt here.


