Note: This blog addresses some features of the custom visual that will be available in the App Source in the upcoming weeks. To get this latest build, reach out to us here.
This blog is part of the Bullet Chart Blog Series
As proposed by Stephen Few, the Bullet chart was developed to overcome the fundamental issues of gauges and meters to visualize Key Performance Indicators (KPIs). xViz has released a new PBI Certified version (1.1.7) of the Bullet Chart, which supports several new use cases such as single KPI as well as the IBCS improvements to the bullet chart. Following are the list of new features –
New Features of v1.1.7
- IBCS bullet chart use case – with and without comparison band
- 8 Prebuilt Bullet chart Templates
- Variance Bar
- Single KPI use case with band names
- Ranking
- Sorting on Variances
- Analytics section
- Target and Comparison of band enhancements
- Data label enhancements
Latest Features – Description
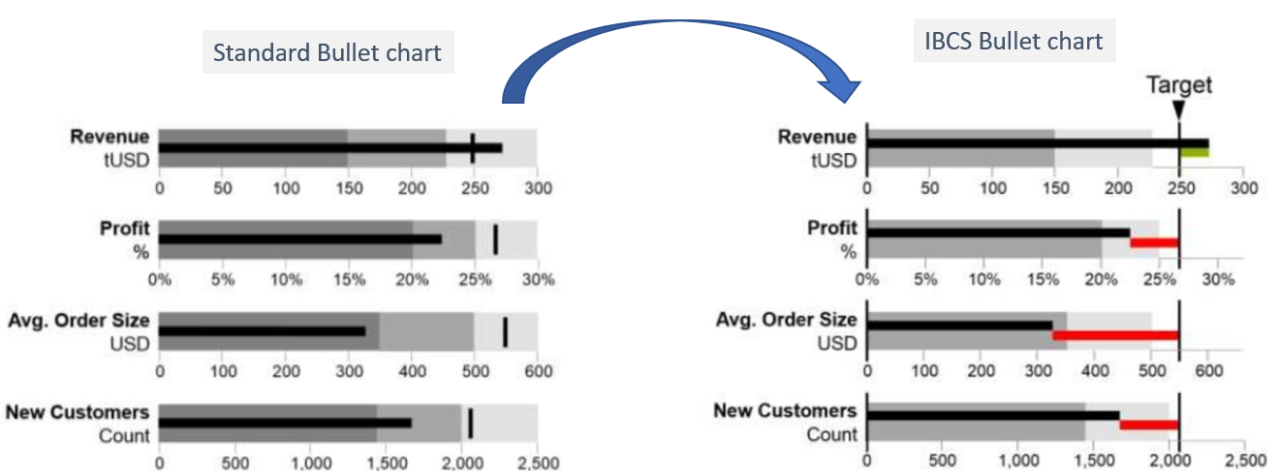
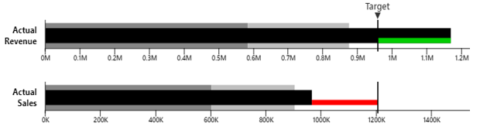
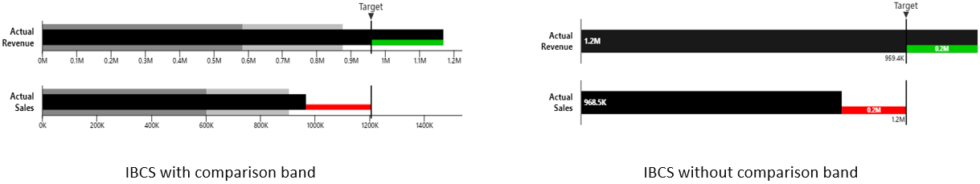
- IBCS Bullet Chart
The IBCS bullet chart, recommended by the IBCS institute is an enhanced version of the standard bullet chart developed by Stephen few, which consist of three main areas of improvements for effective visualization which are as follows:- Omit the third range (light gray) because it has an arbitrary length
- Normalize target values to facilitate the visual evaluation
- Highlight positive and negative variances to understand the chart more quickly
The xViz Bullet chart visuals support two types of IBCS Bullet chart templates, which are as follows:
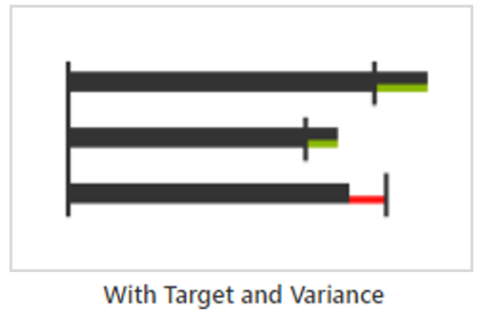
Please note: The IBCS bullet chart use case only supports KPIs without category field (only value and no category field). Kindly use Template 3 – ‘With Target and Variance’ in case you would like to configure variance bar across a given KPI split by a category field, for example, compare Actual and Target Sales by Region.
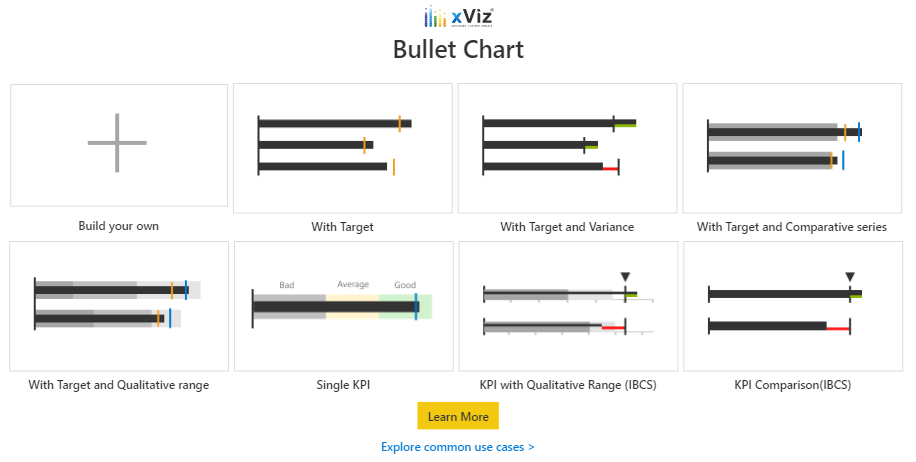
2. Bullet chart Templates
There are 8 commonly used prebuilt bullet chart templates to quickly get you started without having to navigate the additional property sheet and hunt for respective properties to achieve your use case. All you need to do is select the desired template and assign the respective values unique to each template. Once all the values are assigned, hit the create button and the chart will be ready.
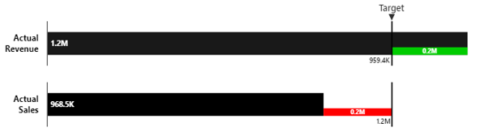
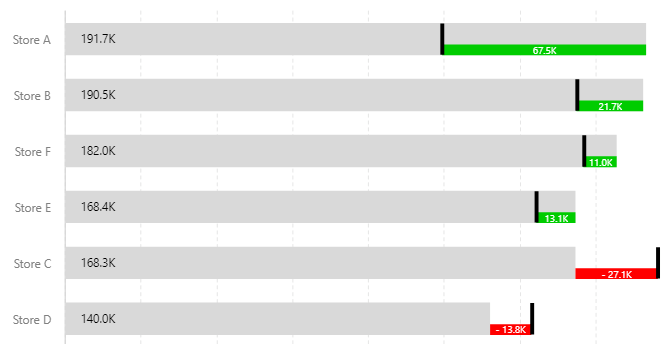
3. Variance Bar
As the name suggests, the Variance bar helps highlight positive and negative variances between actual and target value, thus making the chart easier to read and understand the overall health of the KPI. The variance bar can be enabled for both IBCS and standard bullet chart when there is only 1 target value assigned. The following are the different prebuilt templates or use cases which contain variance bar:
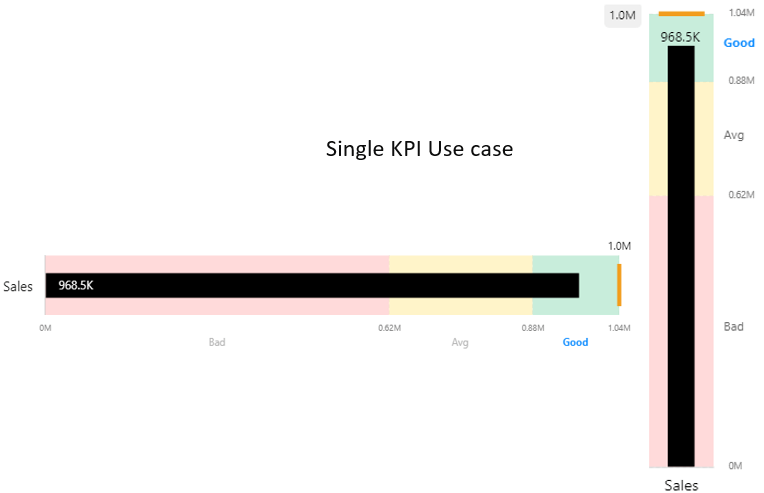
4. Single KPI use case with Band Names
You can configure the Standard Bullet chart both with and without a category field. When configured without a category field, it represents a single KPI. Like the xViz Linear gauge, you can display band labels(bad, avg…) with active band labeling for the single KPI use case.
5. Ranking
Found under the context menu like other xViz Charts, the Bullet chart now supports top/ bottom N ranking with ‘Others’ where the ‘Others’ field buckets all the remaining items together. The ranking can be based on the following values –
- Actual value
- Target Value
- Variance
- Variance percentage
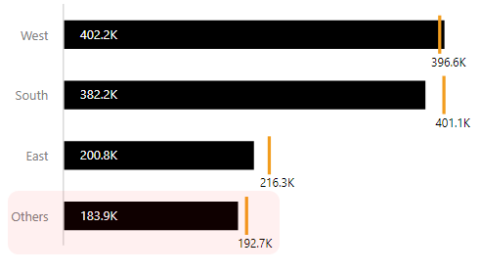
6. Sorting based on variances
Like the Waterfall Chart, the xViz bullet chart provides sorting based on Variances for only Standard bullet chart use case when the variance bar is enabled. You can sort both ascending and descending based on variance and variance% values to help focus on the top or bottom performing categories.
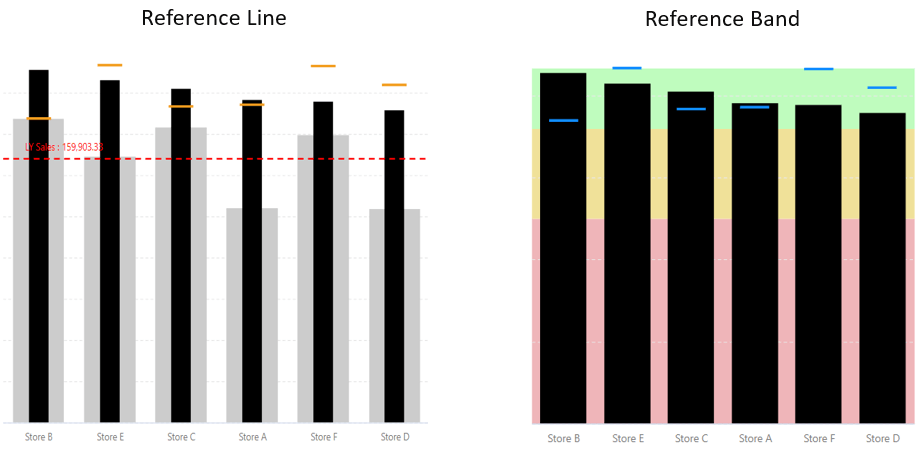
7. Analytics section
Support for reference lines and reference bands has been provided with the addition of the Analytics Tab as part of the Advanced Editor section. You can create multiple reference line and bands for advanced use cases
8. Target and Comparison Band enhancements
With this new release, we have moved the Target and Comparison band section from the Format pane to the Advance Editor section to support both standard and IBCS bullet chart use cases.
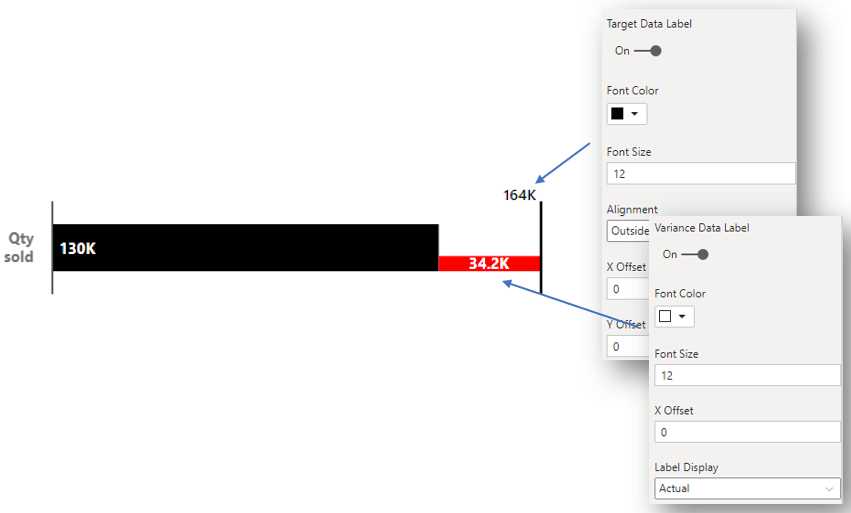
9. Data label enhancements
The data label section has been enhanced to provide data labels for Target and Variance bar along with Actual Value. In the case of the variance bar, you can choose between actual and percentage variance display along with standard formatting and positioning options.
***
The Bullet Chart is a part of the xViz Pro Suite, check out all the resources including other blogs, and FREE Power BI Desktop Version!