One of the key uses of a Gantt chart is to visually represent the project roadmap, which is composed of tasks or phases. In a typical project, these tasks are interdependent, which means that the start or end of one task can affect the execution of another task.
For instance, in a software development project, the testing phase would typically depend on the completion of the development phase. To illustrate these dependencies, connectors are used in the Gantt chart. Connectors provide a clear visualization of the relationships between tasks and the order in which they must be executed.
To plot the connectors in the visualization, we need to provide the following details:
- "Connect To" - specifies the task that the current task must be connected to represent the dependency between the two tasks.
- "Connector Type" - specifies the direction of the dependency between the tasks.
The acceptable values for this field are combinations of the words ‘Start’ and ‘End’ denoting the position of the connector line in source and destination bars:
| Value | Description | Use case |
|---|---|---|
| StartStart | Start of the source task is connected to the start of the dependent task | ‘UI/UX designing’ (dependent) cannot start without ‘Requirements Gathering’ (source) starting |
| StartFinish | Start of the source task is connected to the end of the dependent task | Start of ‘QA Testing’ marks the end of ‘Development’ activities |
| FinishStart | The finish of the source task drives the start of the dependent task | ‘UI development’ (dependent) can start only after the completion of the ‘UI/UX designing’ (source) |
| FinishFinish | The finish of the source task drives the finish of the dependent task | Completion of ‘UI/UX review’ (source) allows the completion of ‘UI development’ (dependent) |
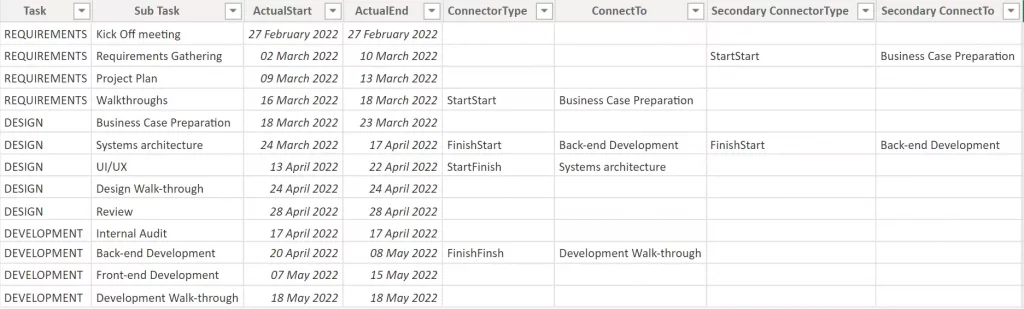
Here is an example of a sample dataset to plot the Gantt timeline of a software development project:
The project is divided into 3 broad tasks: “Requirements, Design, and Development” and each task is broken into various subtasks. There are a few dependencies within these subtasks:
Subtask “Business Case Preparation” cannot start before “Walkthrough” starts.
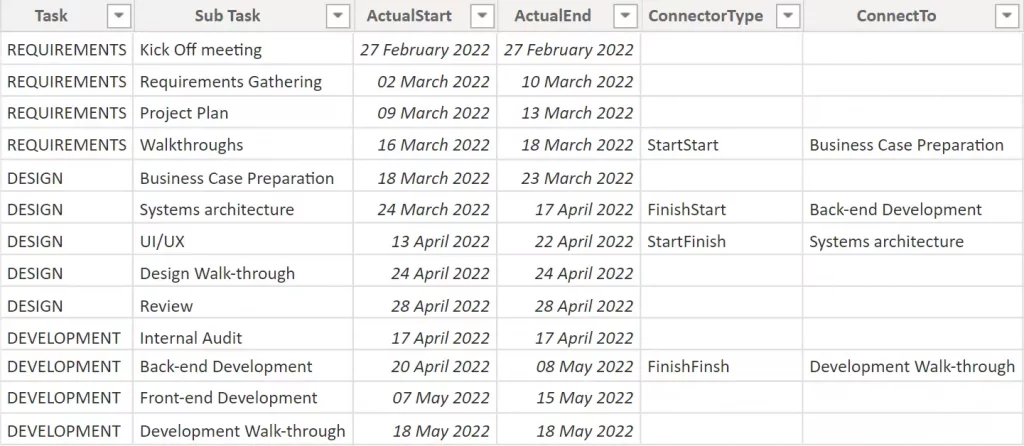
Similarly, we have defined a total of 4 dependencies in this dataset from Walkthrough, Systems architecture, UI/UX, and Back-end Development subtasks with different connector types to specify the direction of the connector.
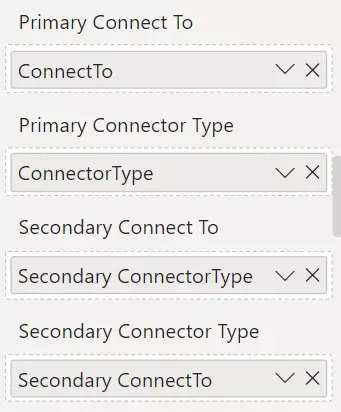
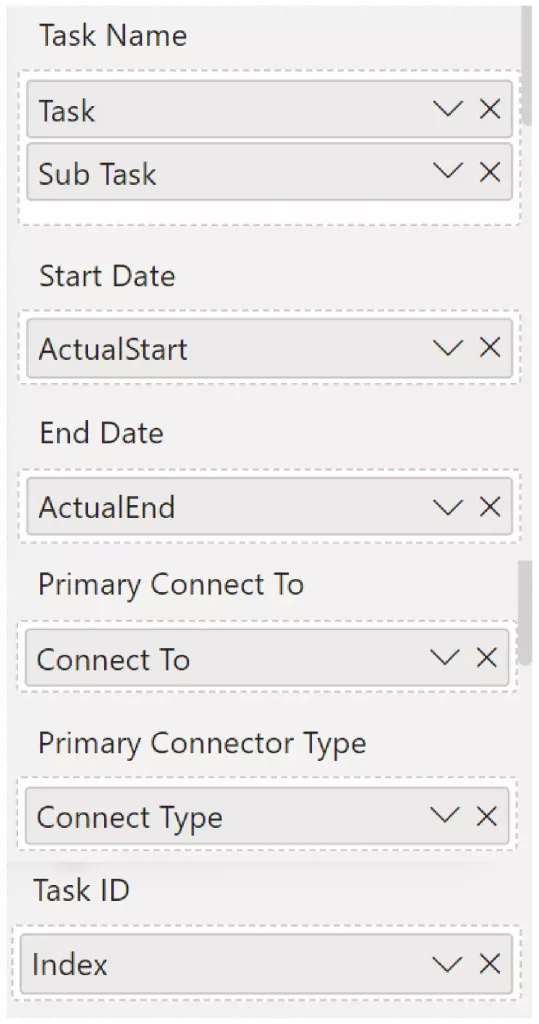
The columns must be inserted in the data fields as shown below:
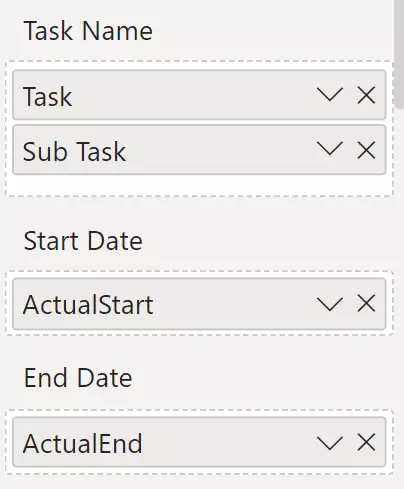
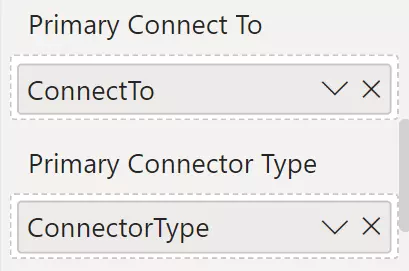
Task and Sub Task columns will define the hierarchical structure of the category. ‘ActualStart’ and ‘ActualEnd’ will provide the start and end dates for the timeline bars. ‘ConnectorType’ and ‘ConnectTo’ define the properties of the connector lines.
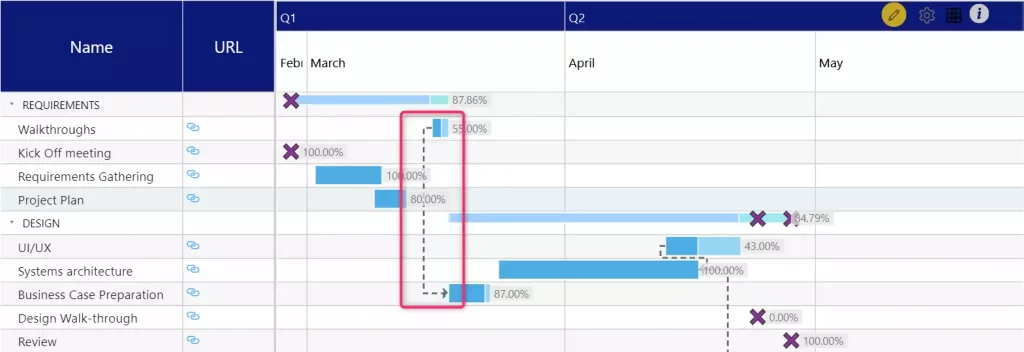
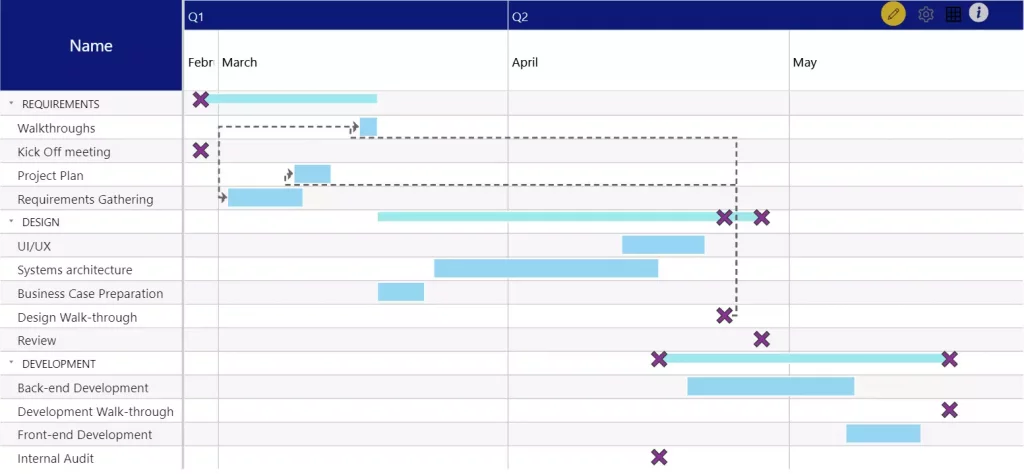
Here is the output of the above data configuration:
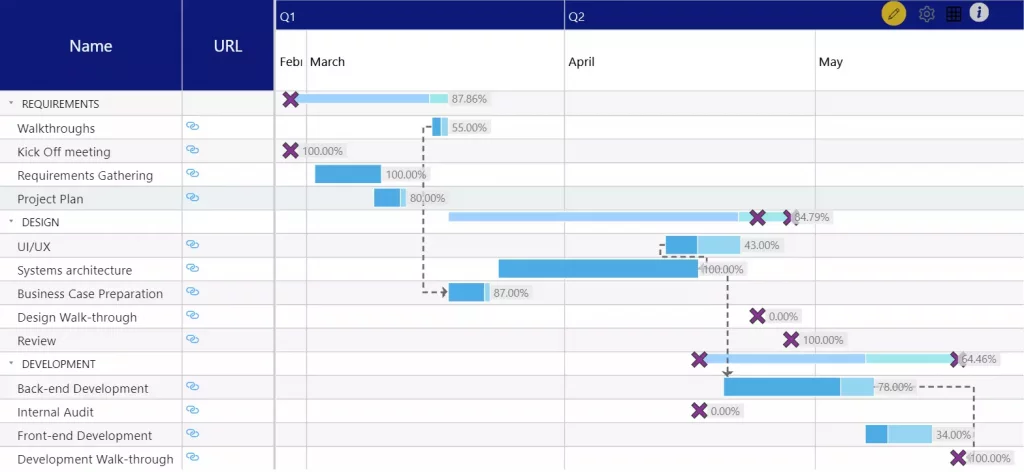
Multiple Connectors using Primary and Secondary fields:
There can be scenarios where a subtask is involved in multiple dependencies. The secondary connector fields are used to visualize multiple such connectors.
In the same example, two more columns have been added to create multiple connectors:
Secondary connector fields are helpful to plot multiple connectors from the same task/sub-task. In this sample data, multiple connectors are needed for the ‘Systems architecture’ subtask. Hence, both Primary and Secondary fields are needed.
In addition to the fields populated in the earlier example, we will also populate the ‘Secondary Connect To’ and ‘Secondary Connector Type’ fields to create multiple connectors:
As shown in the below image, with the help of the secondary connector fields, multiple connectors are created for the ‘Systems architecture’ bar:

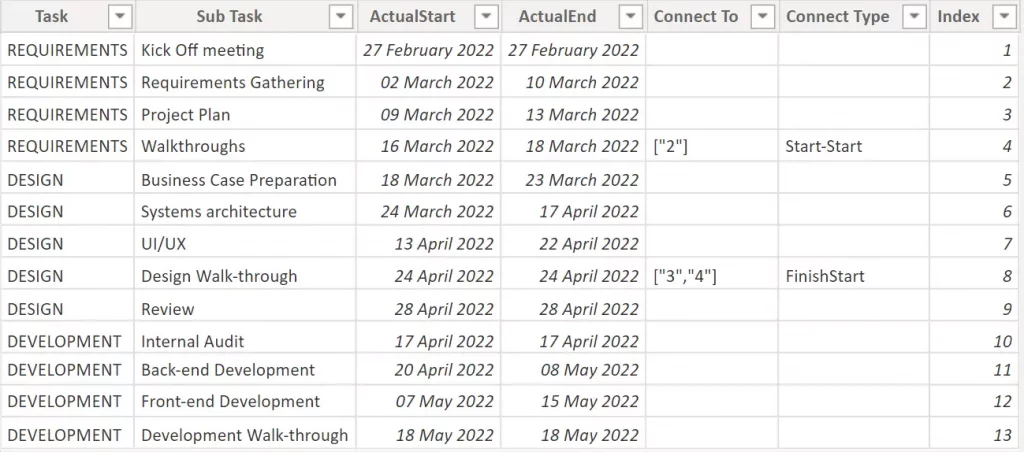
Require more connectors? We have a solution:
Using the primary and secondary data fields, one would think that at the maximum only two connectors can originate from a task. However, you can add even more connectors. Use comma-separated task IDs in the ‘Connect To’ field to create multiple connectors from one task.
In a project execution, certain tasks are dependent on other tasks. To ensure the timely completion of the project, it’s important to visualize the dependencies of the tasks. Connectors in the xViz Gantt Chart provide an executive view to understand the dependencies, thereby making it effective for project managers and other users to visualize and manage the workflow.
The connector is just one of the many powerful features in the Gantt Chart. Explore more features of the xViz Gantt chart with a 30-day free trial on Microsoft AppSource here.