This blog is part of the Hierarchy Filter / Advanced Hierarchy Slicer Series.
In case you happened to miss out on the recent Webinar by Anoovendhan Subramanian on xViz Hierarchical Filter, here is a quick highlight on some of the latest features added to our new xViz Hierarchy Filter- Version 1.1.2
- Value Filter / Measure Filter
- Conditional formatting option for Parent nodes
- Context Menu – Conditional formatting options
- Single child Display / Ragged Hierarchy Handling
- Enhanced UI/ UX – New Appearance Tab display and styling options
- Improved Dropdown and Search experience
- Node Styling options
- Row and Value column width
- Expand/collapse Icon
- Improved column headers
Features – Description
- Value Filter / Measure Filter
In case you have values assigned to your xViz Hierarchy Filter, the new value filtering could be helpful for looking at an additional filtering scenario. For example, you may want to focus on a product with gross margins under a certain range or below a certain threshold.
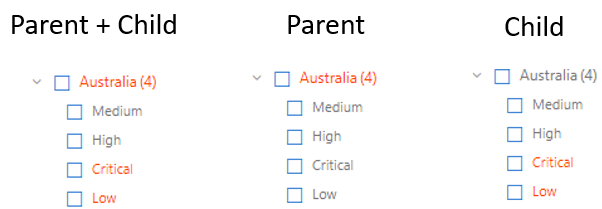
2. Conditional formatting option for Parent nodes
Along with child nodes, you can now conditionally format parent nodes as well. This makes it easier to navigate large hierarchies as end users can visualize the areas(highlighted) which need their attention and chose their path to drill down
4. Single child Display
This feature is useful for unbalanced Hierarchy scenarios where there could be parent nodes with only a single child node. The different single child display options in the measure filter visual are as follows:
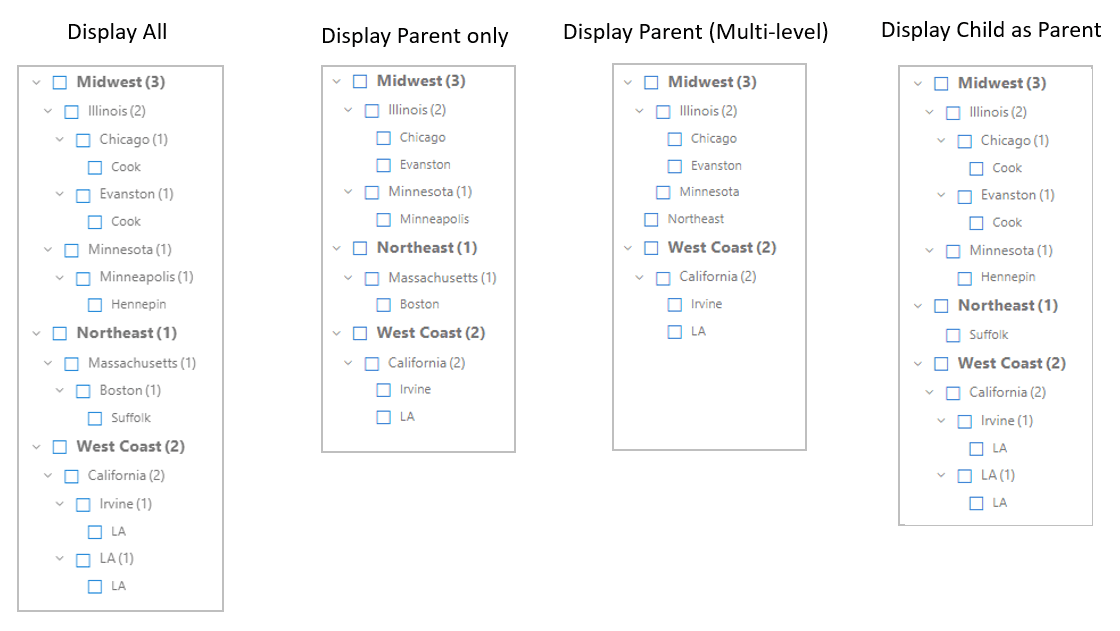
- Display Parent Only – Display till last parent node having a single child. The child level is hidden in case it is the only child e.g. The Northeast region expands only till Boston thereby hiding the only child Suffolk.
- Display Parent (Multi-Level) – Like Display Parent only option but this will work for more than one level. So, in case there more than 1 level having a consecutive single child then all the consecutive parents will be hidden, and the child moves up the level. e.g. Since the Northeast region has only one child at each level. Therefore, it shows only Northeast
- Display Child as Parent – Skips the parent node having a single child. The child node will move one level above in case it is a single child in the advanced hierarchy slicer. e.g. Since Suffolk has parent nodes having a single child, therefore the Northeast region ends directly into Suffolk and skips Massachusetts and Boston
5. Improved Dropdown Experience
6. Node Styling Options
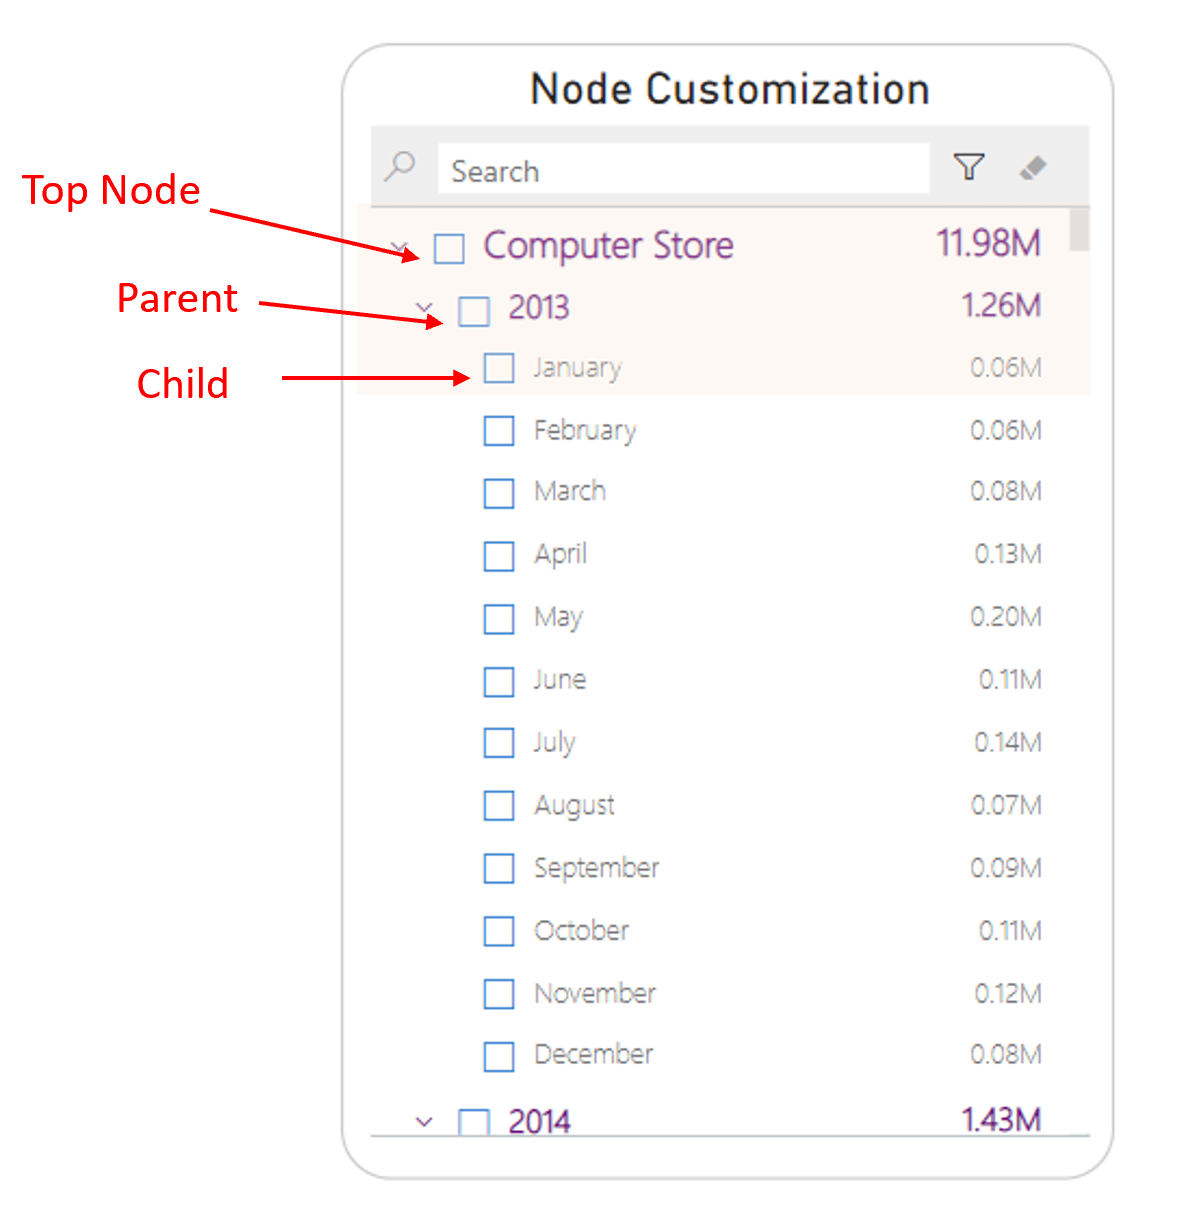
Node styling helps the hierarchy levels stand out so that you can easily visualize the hierarchy flow and figure out the top or parent node from the list. You can assign different color, font style and size to visually pop out from the norm
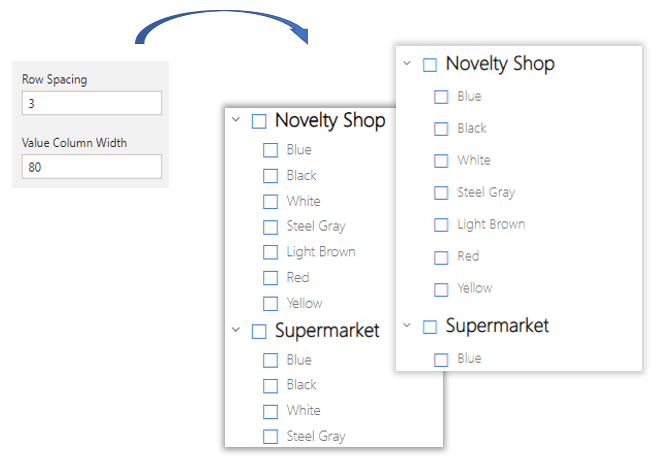
7. Row and Value column width
More control over the filter layout with row and value settings. The row settings can make sure that your rows are better spaced even when you have different font sizes for Top, Parent, and Child nodes. The value column setting width will allow enough space for the values from being cut off and optimum real estate for category labels.
8. Enhanced UI/ UX – New Appearance Tab display and styling options
The property sheet has been updated with new styling option and control settings to enhance the UI/UX of the Hierarchy Slicer.
- You can now easily toggle between different interactions- Default, on hover and on the selection with a simple dropdown menu
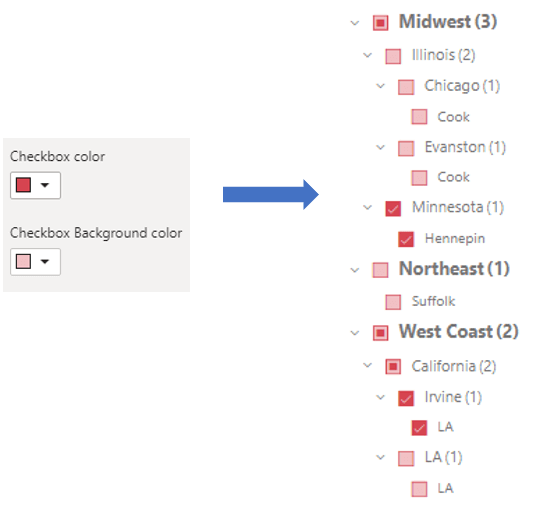
- Checkbox fill and background color options
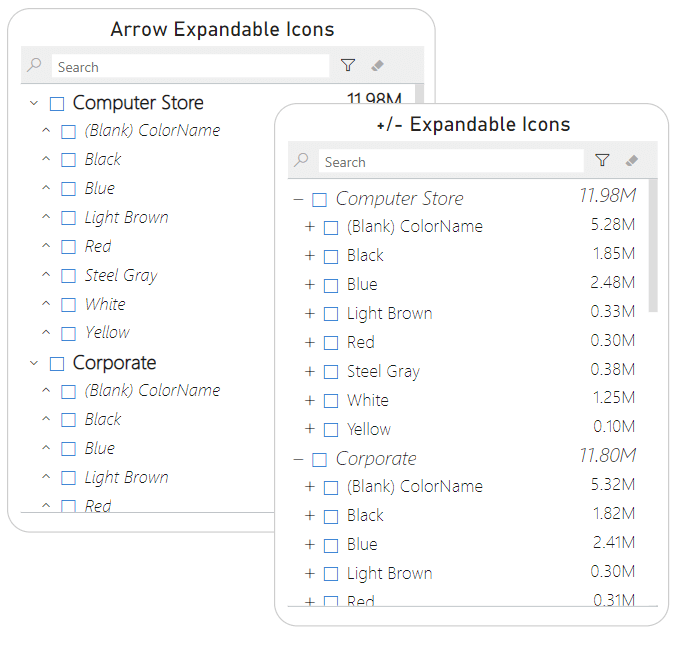
9. Expand/ collapse Icon
Choose between different icon styles for your xViz Hierarchy Filter based on your enterprise preferences
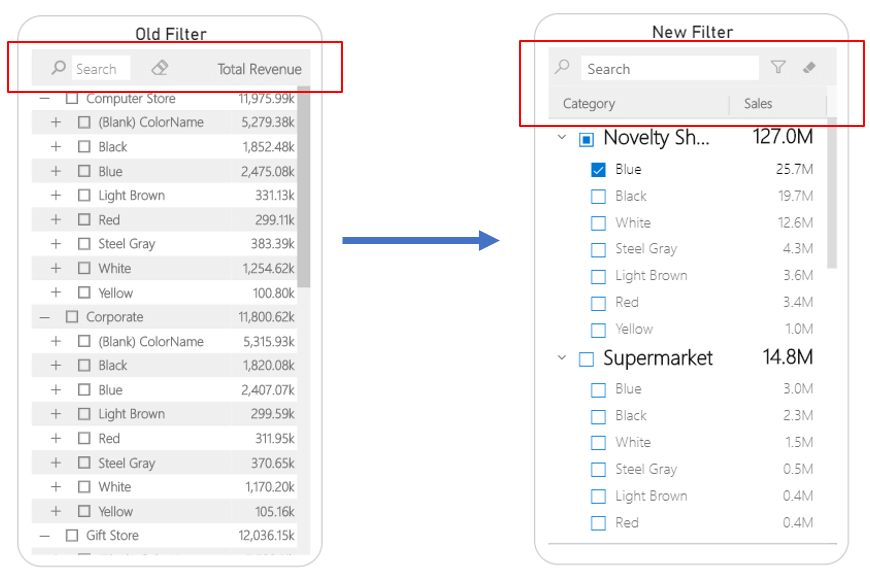
10. Improved column header
Unlike the previous version where the search bar would overlap the columns header, the new version has separate column header section which can be turned on/off as desired
11. Report Tooltips
The xViz Hierarchy filter provides support for Report tooltip just like other xViz Pro Visuals. You can display additional context and information in the form of visualizations using the tooltip. In the below example, we can analyze Revenue for the Last 3, 6, and 12 months along with current and last month revenue comparison for each of the Price bands. This was you can get a complete picture of how each segment of your business is performing across the hierarchy
***
To get the latest version of the custom visual, reach out to us here.
You can take a look at the other advanced custom visuals by xViz here.