Note: For the Latest Feature Updates to xViz Hierarchy Filter Power BI Visual, check this blog out!
Introduction
This month we release 3 new visuals as part of our xViz suite of visuals for Power BI in the Microsoft App Source –
- Advanced Gauge
- Hierarchy Filter
- Hierarchy Tree
Of which my personal favorite is the Hierarchy Filter.
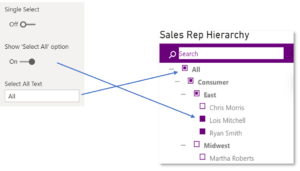
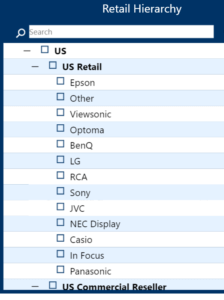
The Hierarchy Filter is a selector component like a slicer, just that it can display multiple category values in an expandable tree view used to display hierarchical nodes for filtering. Each node can be expanded and collapsed for optimal navigation through the hierarchy and single/ multiple selections can be made to select the desired nodes.
Now let’s look at some of the key features of the xViz Hierarchy Filter which would help you easily slice and dice your data by providing a simple hierarchy tree view
Filter Settings – Category Display
You can configure the filter interaction and category display setting using the filter settings.
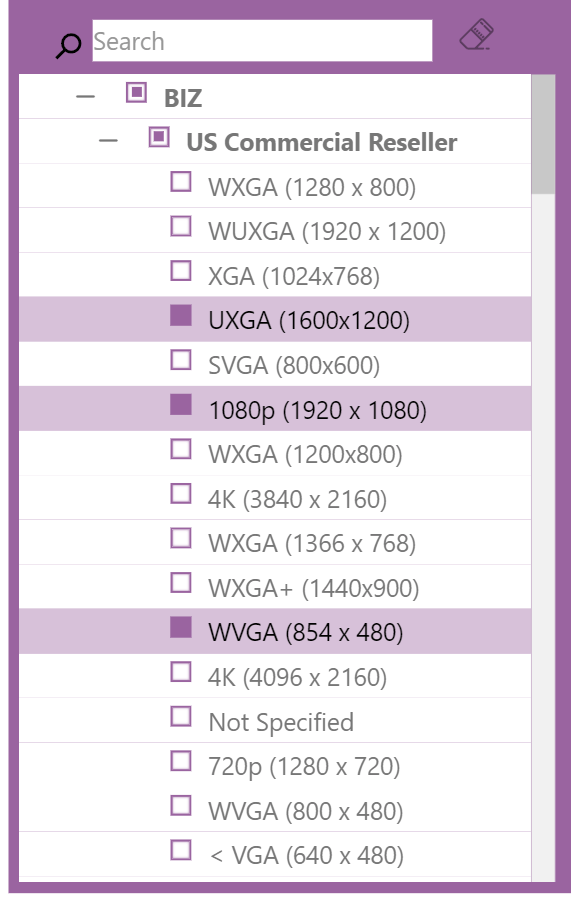
- Single select/ Multi select node selection
The user can either configure the filter to act as a single select or multi select option.
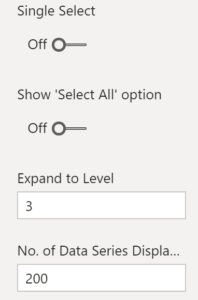
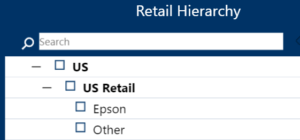
2. Category Display Settings
The default category level to be displayed along with no of the hierarchical attributes to be displayed can be configured using the following two properties.
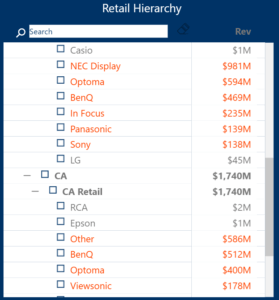
Display Measure value
Along with the categories, the xViz Advanced Hierarchy filter also gives the option to display measure values. This way one can have a quick snapshot of the most important KPI for each of the category values. For e.g. you could display sales values for the xViz advanced Hierarchy Slicer for Power BI and conditional format is based on whether it has met the target or not. This way you could quickly focus on the categories which haven’t met the target.
Appearance Settings
xViz provides a robust set of appearance settings for better styling and interaction capabilities which are listed as follows:
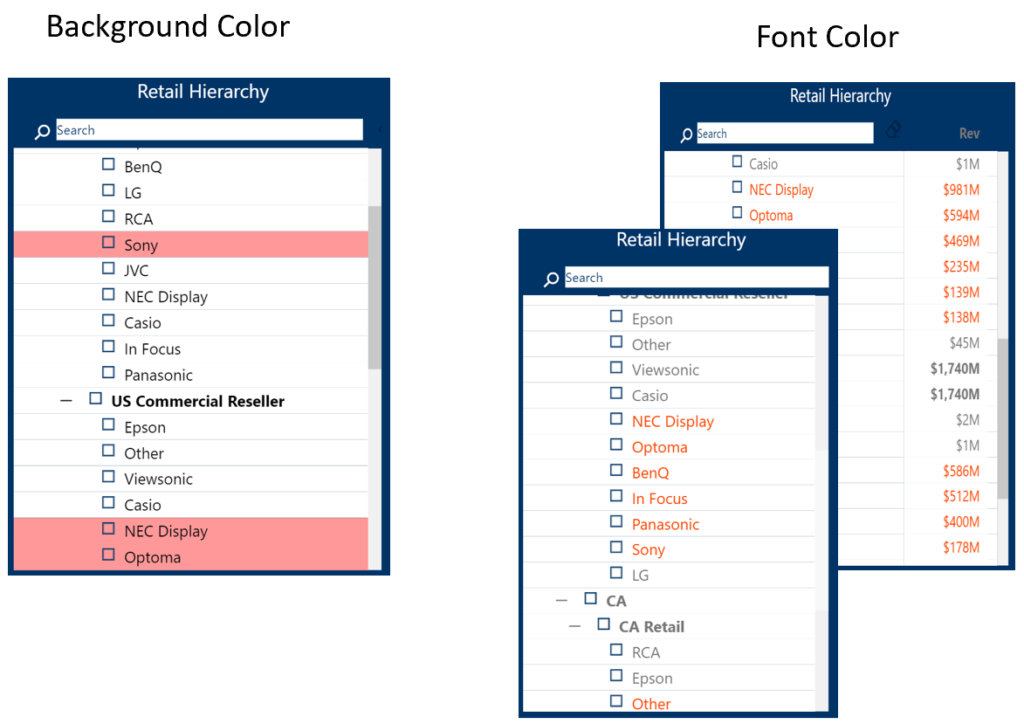
- Alternate row Color
Just like the Table, the advanced slicer for Power BI provides alternate row coloring for better readability.
2. Selected value customization
It becomes a lot easier as an end-user to quickly identify the selected filter value if it is styled differently from the rest of the items.
3. Hover customization
Ability to define hover color
4. Icon Colors
Filter, Search, Search text
Conditional Formatting
Just like the charts, the Advanced Hierarchy Slicer from xViz can also be conditionally formatted. This property comes in very handy as it helps end-user to spot the outliers quickly and navigate to the pain points. Conditional formatting is part of the pro feature and can be done by assigning a color to both font and background.
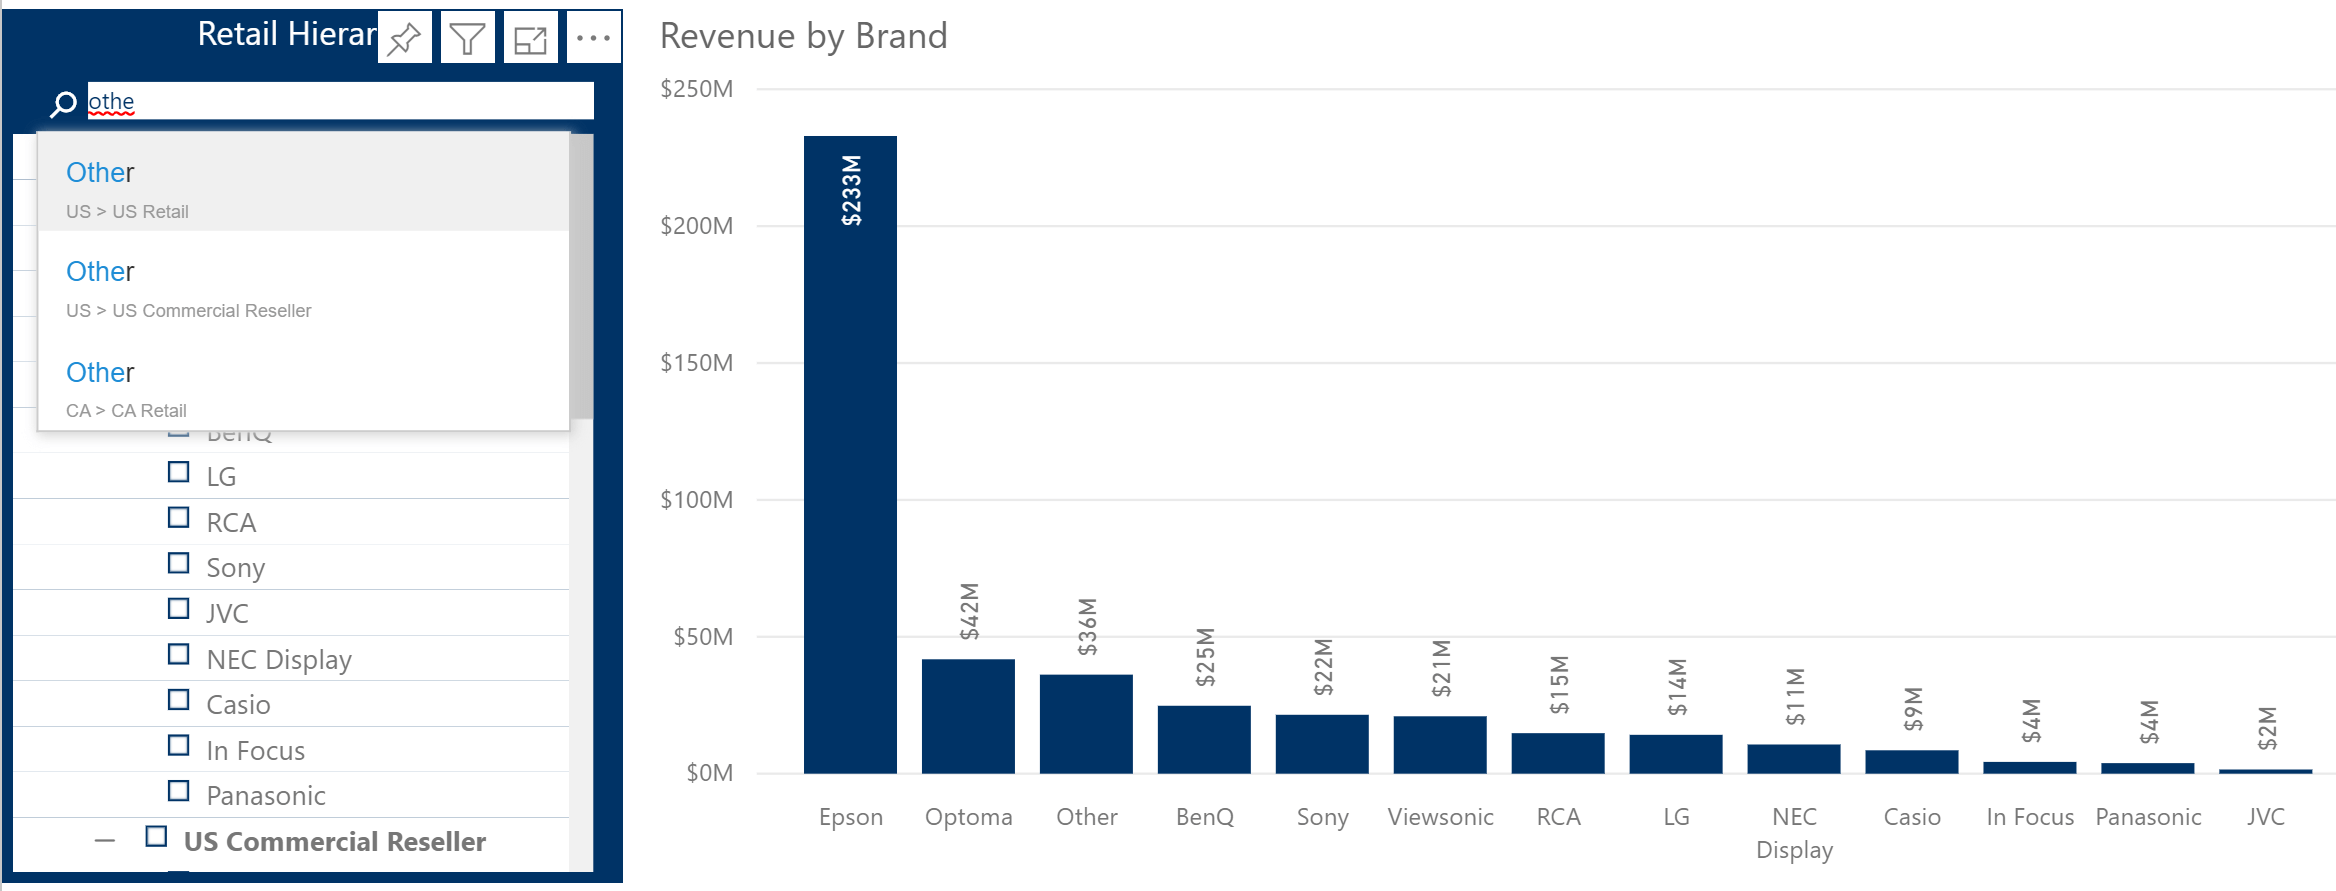
Search Capability
The xViz Hierarchy Filter custom visual provides a search functionality, which allows users to search for a particular value across the complete hierarchy. There are 2 different types of search operations you can choose from
- Filter
Filters the dashboard based on the searched value
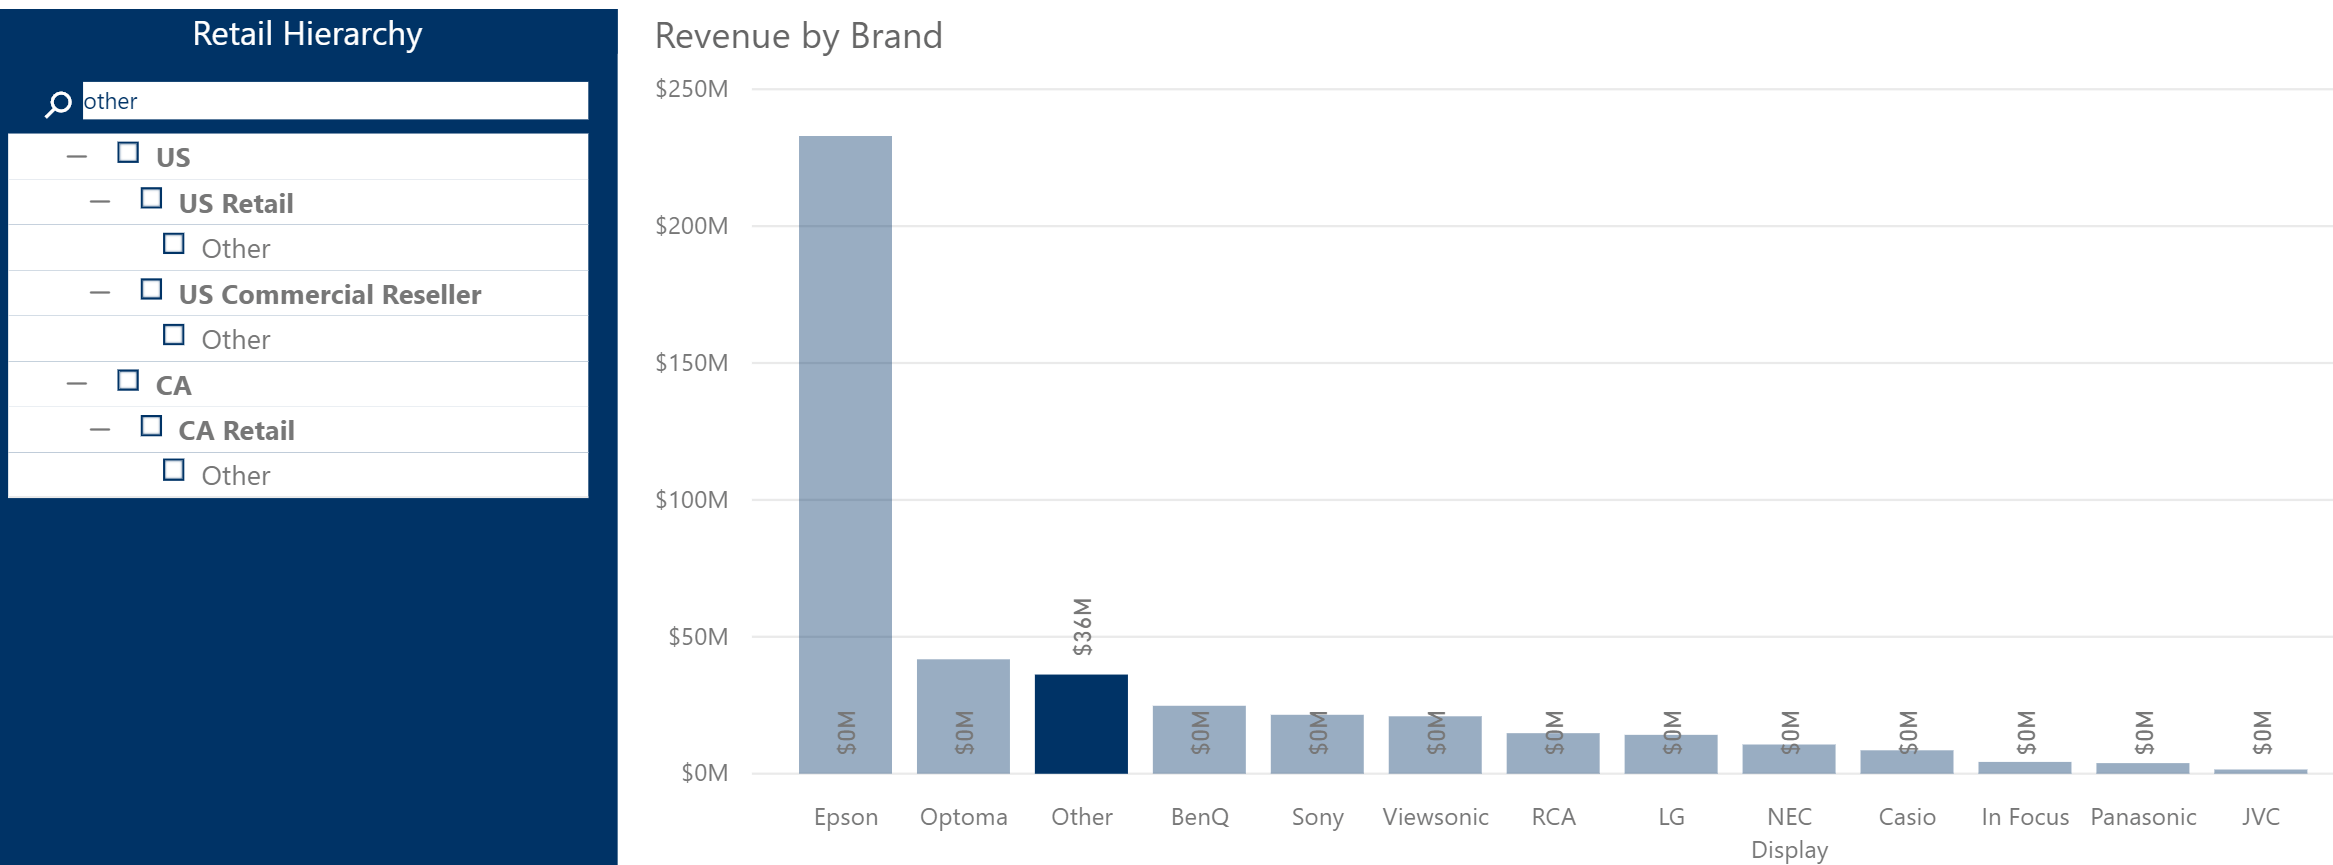
2. Find and Seek
Displays the values being searched without affecting the dashboard
Runtime options
- Clear filter
Clear all select nodes - Custom context Menu
The context menu provides you the option to expand/ collapse the hierarchical tree view for easy navigation
Tooltip
If you feel you are limited with having only one measure value in the hierarchical filter. You could try using the tooltip option in order to display additional information for each of the category fields.
***
To get the latest version of the custom visual, reach out to us here.
You can take a look at the other advanced custom visuals by xViz here.