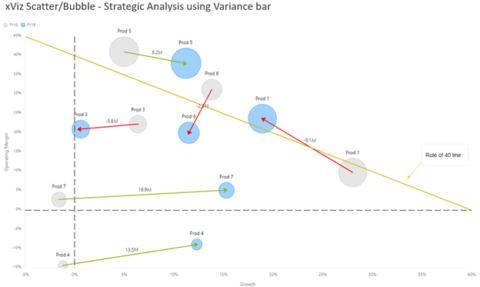
The latest visual to be added to the xViz Visualization Suite is the Scatterplot/Bubble Visual. The xViz Scatter Visual provides a variety of features that are most requested by the Power BI Community. Some of the highlighted ones include – 9 quick start templates which include the Scatter version, Bubble version, and some following IBCS Standards as well!
The Bubble Chart is an addition to the same template and it further enhances the Scatterplot’s information density! it adds a size variable and provides insights using the Conditional Formatting feature. You can now compare 2 different variables, define relationships between them, and perform correlation analysis in Power BI efficiently with the Scatter/Bubble Custom Visual.
Key Features and Frequently asked Customer Requirements:
- Robust Conditional Formatting for outlier detection
- IBCS Standard Templates for Bubble and scatter
- Variance Bar for strategic use cases
- Data Label customization – Display Category and value for each data point
- Analytics section – Custom Lines, Trend Lines, Reference lines & bands
- Runtime options – Ranking with ‘Others’, Zoom in/out, Lasso and Reverse Lasso,
- Annotations for enhanced Storytelling
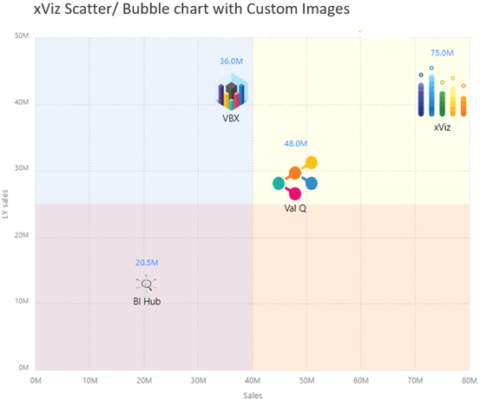
- Bubble Customization – Shape, Size, Pattern, and Custom images (Data URI)
- Axis Ranges for grouping Axis into different bands
You can find the detailed key features for the Bubble /Scatter Chart by clicking here!
***
Check out the Power BI Desktop Summary November Edition featuring the visual here.