Area charts are very useful in visualizing dense data over time. 100% Stacking is a part-to-whole representation of the area chart to focus on the contribution of different categories and across the horizontal axis like time. The xViz Multiple Axes Chart provides a variety of data representations in up to 5 different axes. The data representation can be configured from the ‘Data Series’ option from the formatting pane in Power BI. Configurations can be done from 20+ types ranging from column, line, area, stacked, spline, and so on!
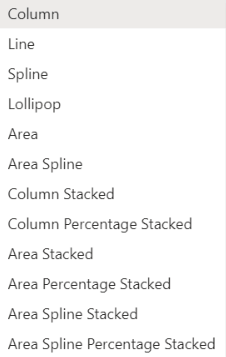
Using the xViz Multiple Axes visual, one can easily configure a 100% Stacked Area chart using the Area Percentage Stacked option with just a few clicks. Here is a short video on how it can be done:
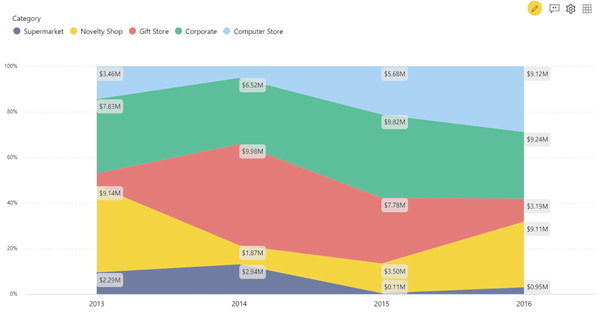
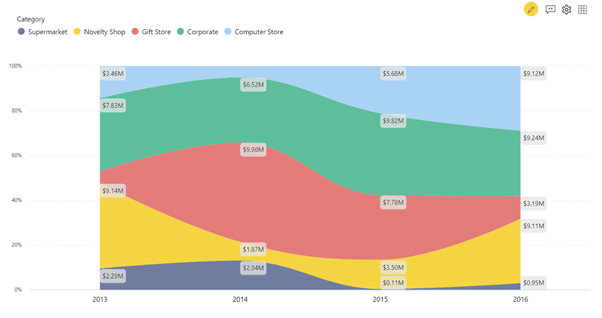
For example, we can derive the following insights from the above-given snapshot:
- For the year 2014, Gift Store has the highest contribution. For the years 2013 and 2016, it has been the one of the lowest contributors to the total revenue for those respective years.
- Corporate category has been able to keep a steady share of contribution in the revenue over the years.
- From the year 2015, Supermarket’s share have decreased whereas that of Novelty increased.
The visual also supports the spline variation of the Area charts using the Area Percentage Stacked option to give a curvy style to the area visualization.
Related Power BI Ideas: 100% Stacked Area Chart in Power BI
******