In every organization, numerous teams operate with designated team leads and managers. Within each team, hierarchies exist with leaders overseeing the individuals working under them.
Consider the scenario, where the manager wants visibility into each team's hierarchy, including the respective team leads, with easy accessibility to streamline management processes.
With the native Power BI visual, it is not feasible to display a team with both, the team leads and the team together. Users are restricted to showcasing either the leads or presenting the team hierarchy, leaving no option to visualize both simultaneously.
Consider an example, where Chairman oversees three heads: QA Engineer, Technical Director, and Manager, each responsible for their respective teams:
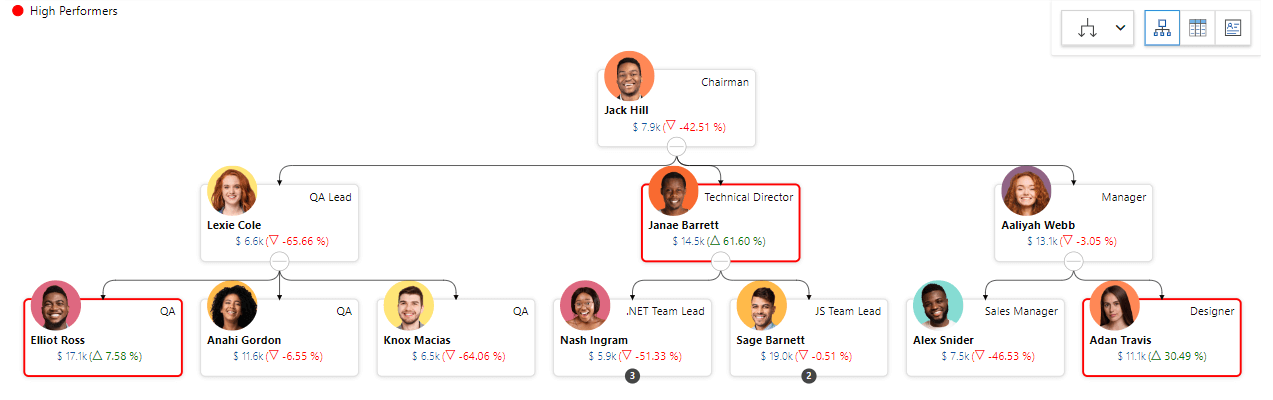
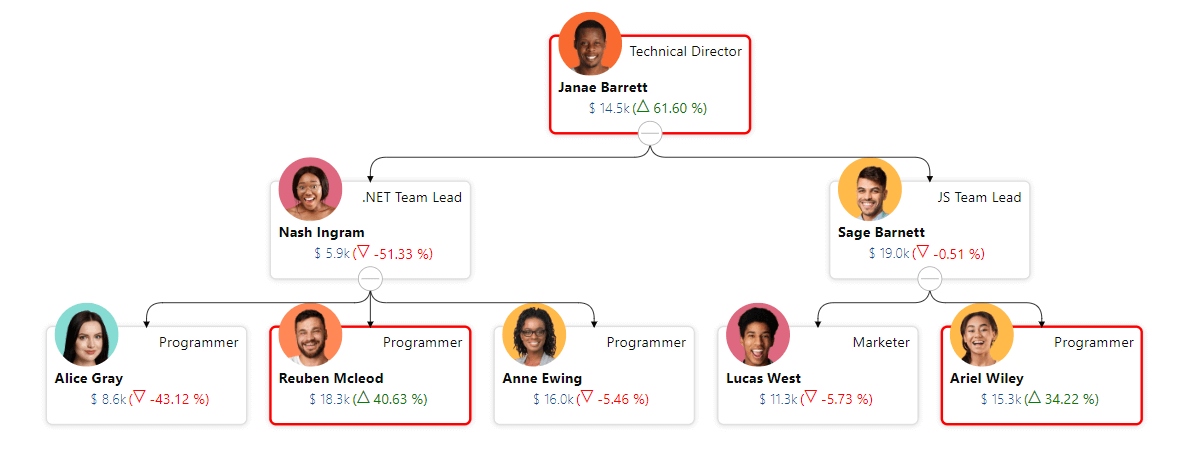
Imagine that Chairman Jack wishes to view the technical team hierarchy, including the Technical Director Janae and members of the entire subordinate team. In simple words, a Subtree of the organization, which shows only the technical team:
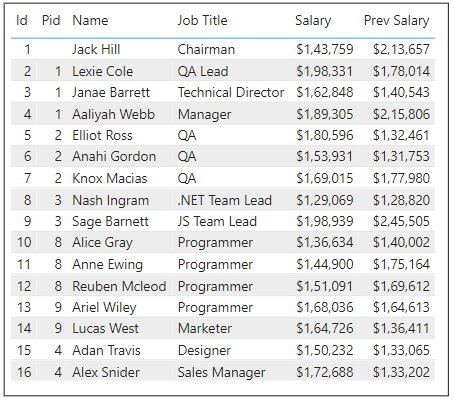
Organization reporting data structures generally use a specific dataset pattern, utilizing ID and PID fields to represent hierarchical relationships:
Let us evaluate the options available with native Power BI filtering to view the Technical Team.
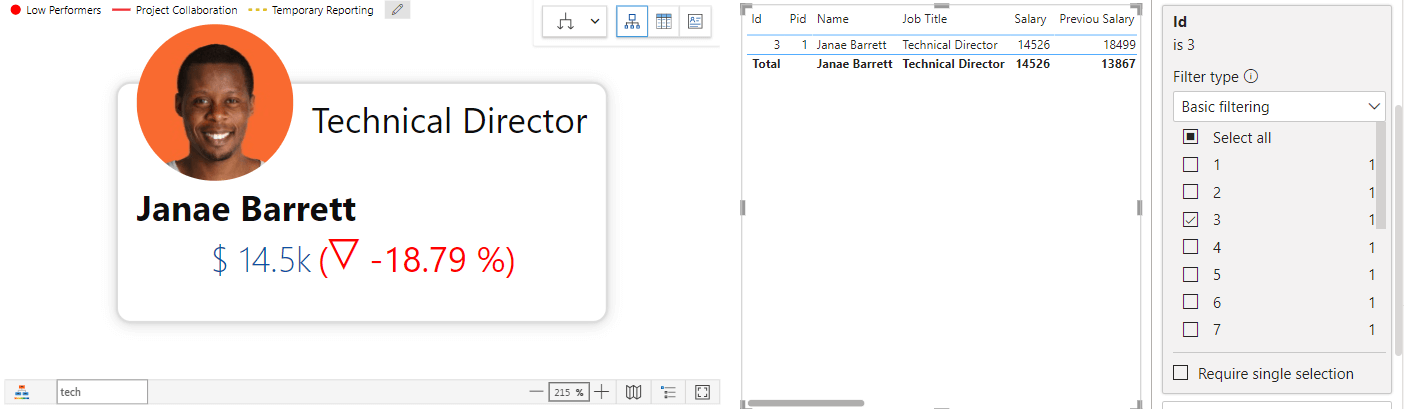
Option #1: Apply the filter on the ID: 3. We will be able to see only the details of Janae Barrett: Technical Director. The details of the Team are not shown:
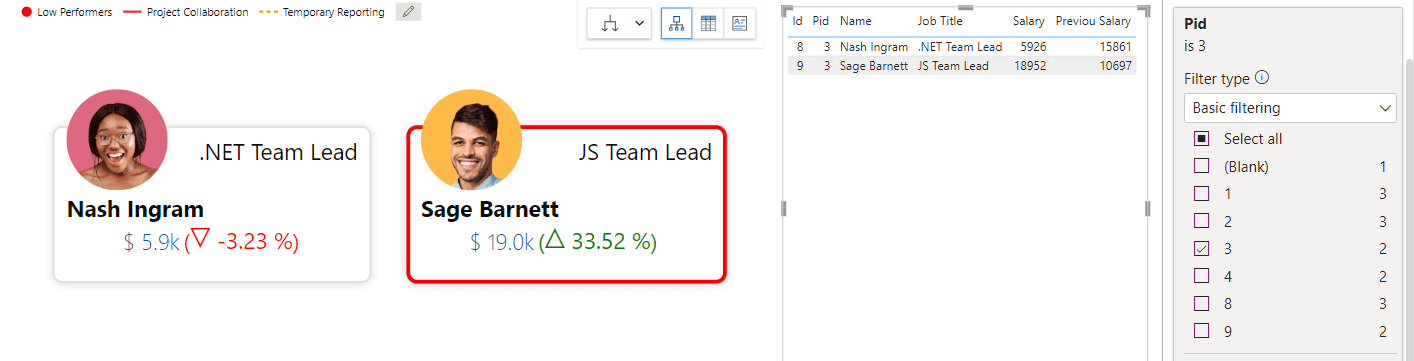
Option #2: If we try to apply the filer on PID:3 only the data of immediate reports is visible i.e., only the data of Nash and Sage but not the data of the rest of the complete, like the subordinates of Nash and Sage:
Using Power BI's basic filtering process, achieving a complete view of the hierarchical structure under Technical Director: Janae is not possible.
With xViz Performance Flow you won't have that problem. Let me show you how:
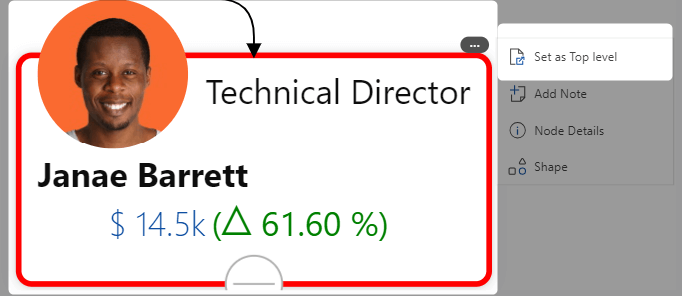
You can utilize the convenient "Set as Top Level" feature, available on top of every node. This feature provides you with the complete hierarchy of a particular person, such as Technical Director Janae, allowing for efficient exploration and visualization of team structures.
Once "Set as Top Level" is selected, you can visualize the structure reporting team of the selected Employee, in other words, the Subtree of the Technical Director. Additionally, we get the button on the top to go back to the default view:
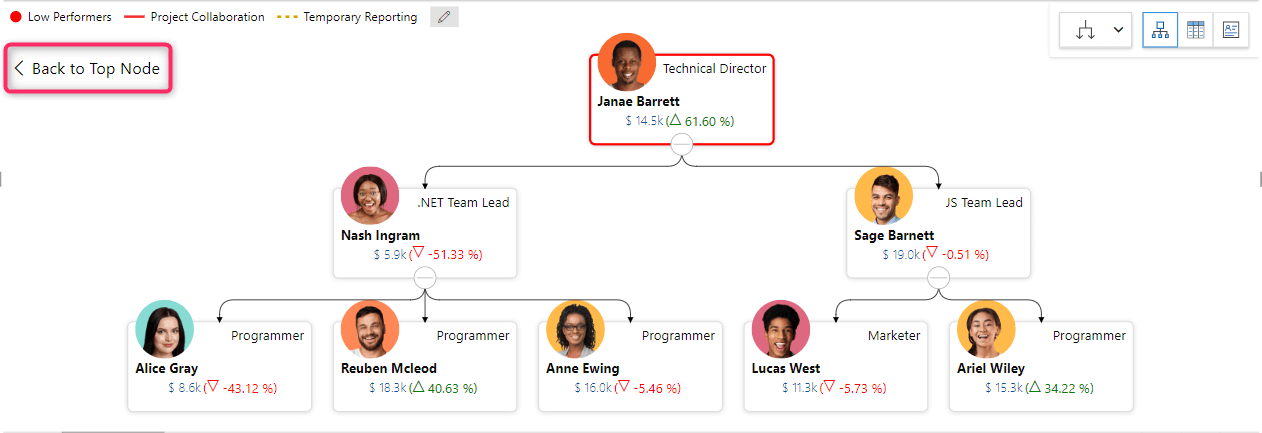
Clicking on "Back to Top Node" enables you to return to the original state, while directly clicking on the page reveals the Technical Director's hierarchy view, simplifying navigation and access to a specific hierarchical structure.
The xViz Performance Flow visual in Power BI offers a streamlined approach to managing and visualizing subtree structures. Through features like "Set as Top Level" and "Back to Top Node," users can seamlessly navigate complex subtree structures. Additionally, viewers have the option to utilize the "Set as Top Node" feature, further enhancing their experience.
You can explore the detailed steps and implementation of “Set as Top Level” here.
Checkout all the exciting features of xViz Performance Flow (Microsoft Certified) on Microsoft AppSource here.