xViz Waterfall Chart Custom Visual, the latest addition to the xViz Suite has been highlighted extensively in the Power BI Desktop Summary Blog for the month of March 2020.
The Waterfall Custom Visual enables business users and BI Practitioners to achieve greater reporting capabilities in Power BI by offering features such as:
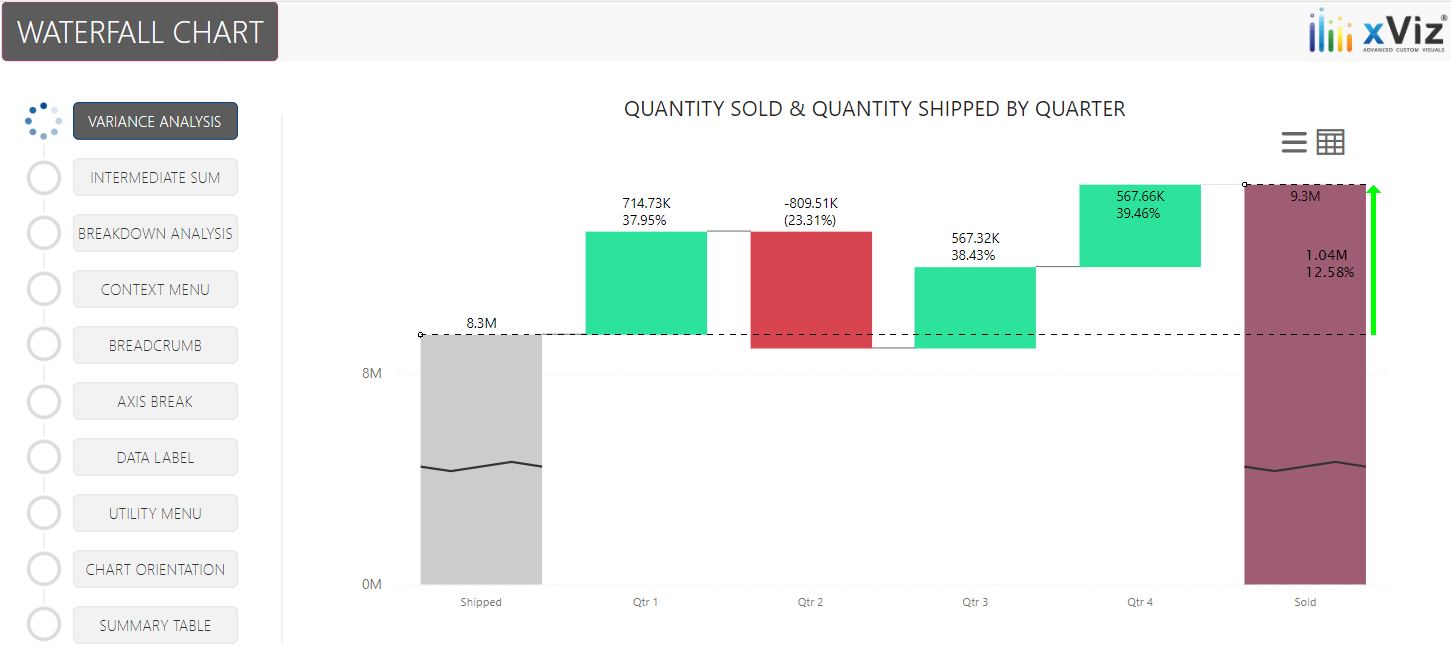
- Variance Analysis – visualize the root cause of a problem by drill down to the lowest level
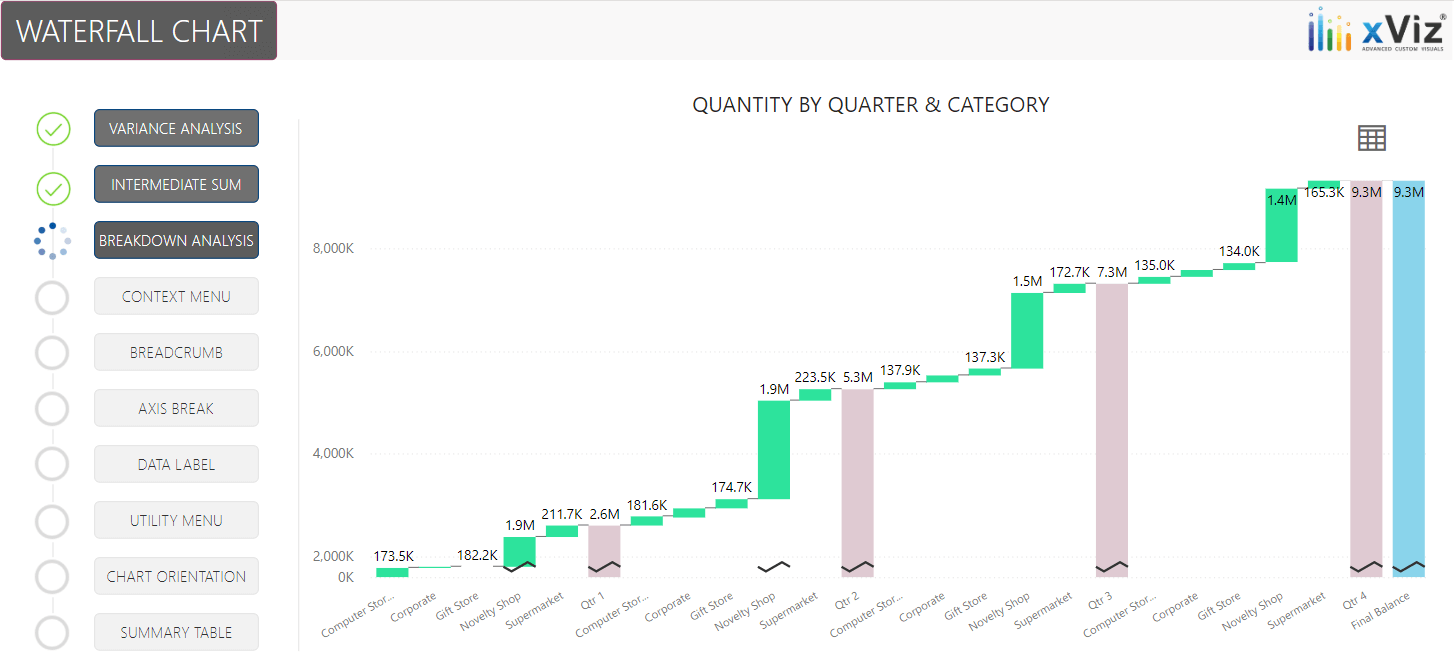
2. Breakdown Analysis – subdivide the chart by a category field to further analyze the contribution by each segment
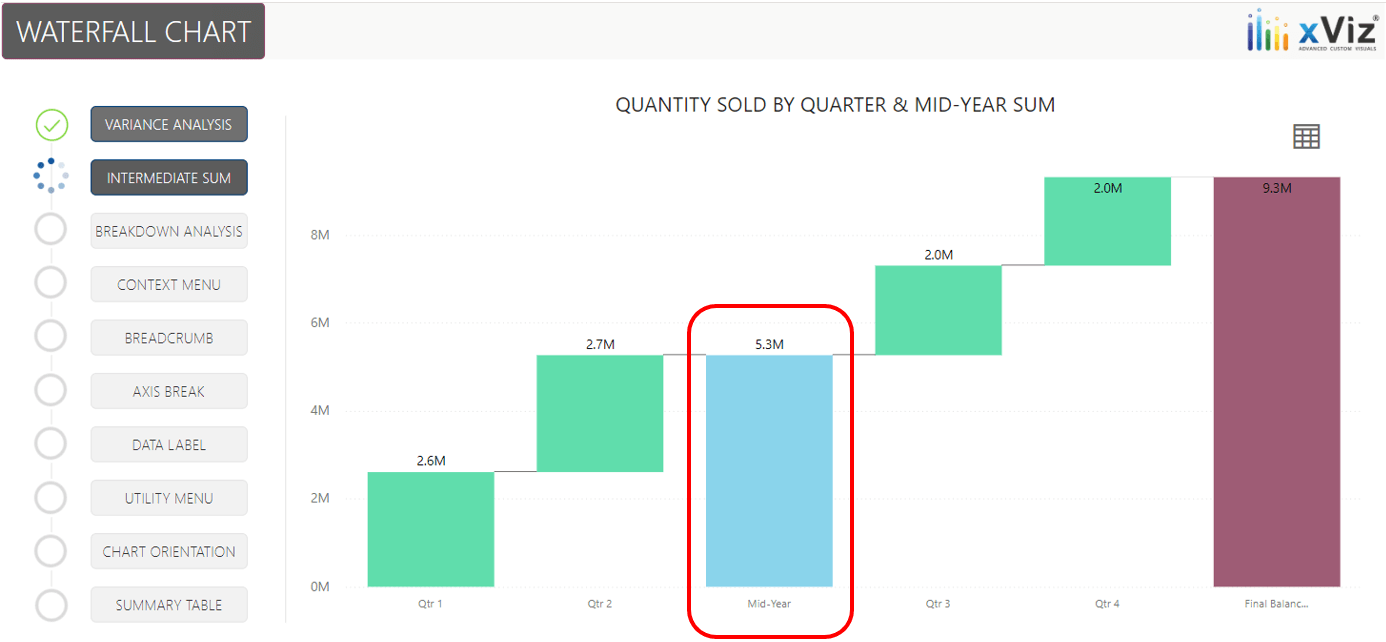
3. Intermediate Sum – display a column as an intermediate sum instead of an additive column
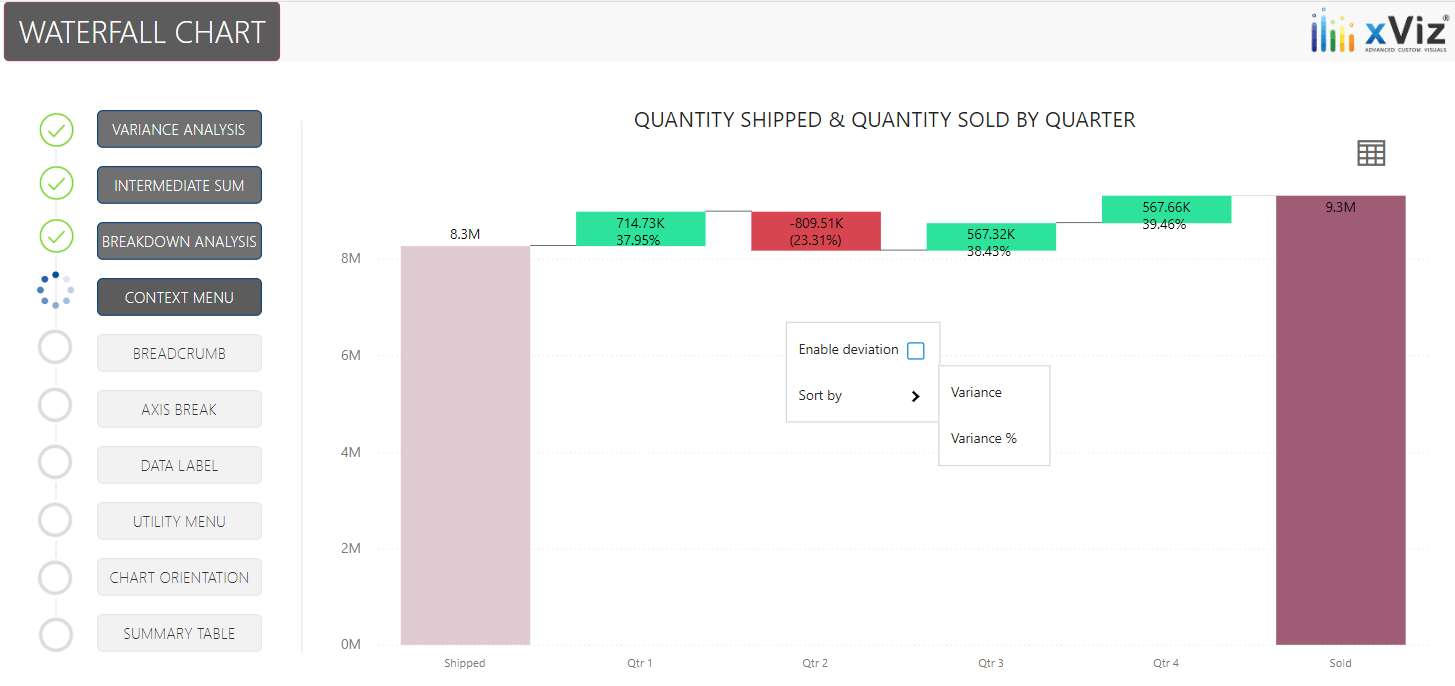
4. Context Menu – caters to two important features at runtime mainly Custom Sorting and Runtime Deviation
There are various other noteworthy features that are offered by the custom visual. You can find them here.
The Waterfall Custom Visual delivers several top requested features from the Power BI Ideas Place.
Check out the Desktop Summary blog by Sujata Narayana here.
You can have a look at the other custom visuals here.