Free 30-Days trial for xViz visuals here!

Microsoft features xViz in its Power BI Desktop Summary Blog for November 2019

Marketing Team
November 13, 2019

Newly Released Charts xViz suite has been highlighted in the Power BI desktop summary blog series for the 3rd month in a row.

The blog talks about exclusive features of 2 custom visuals-

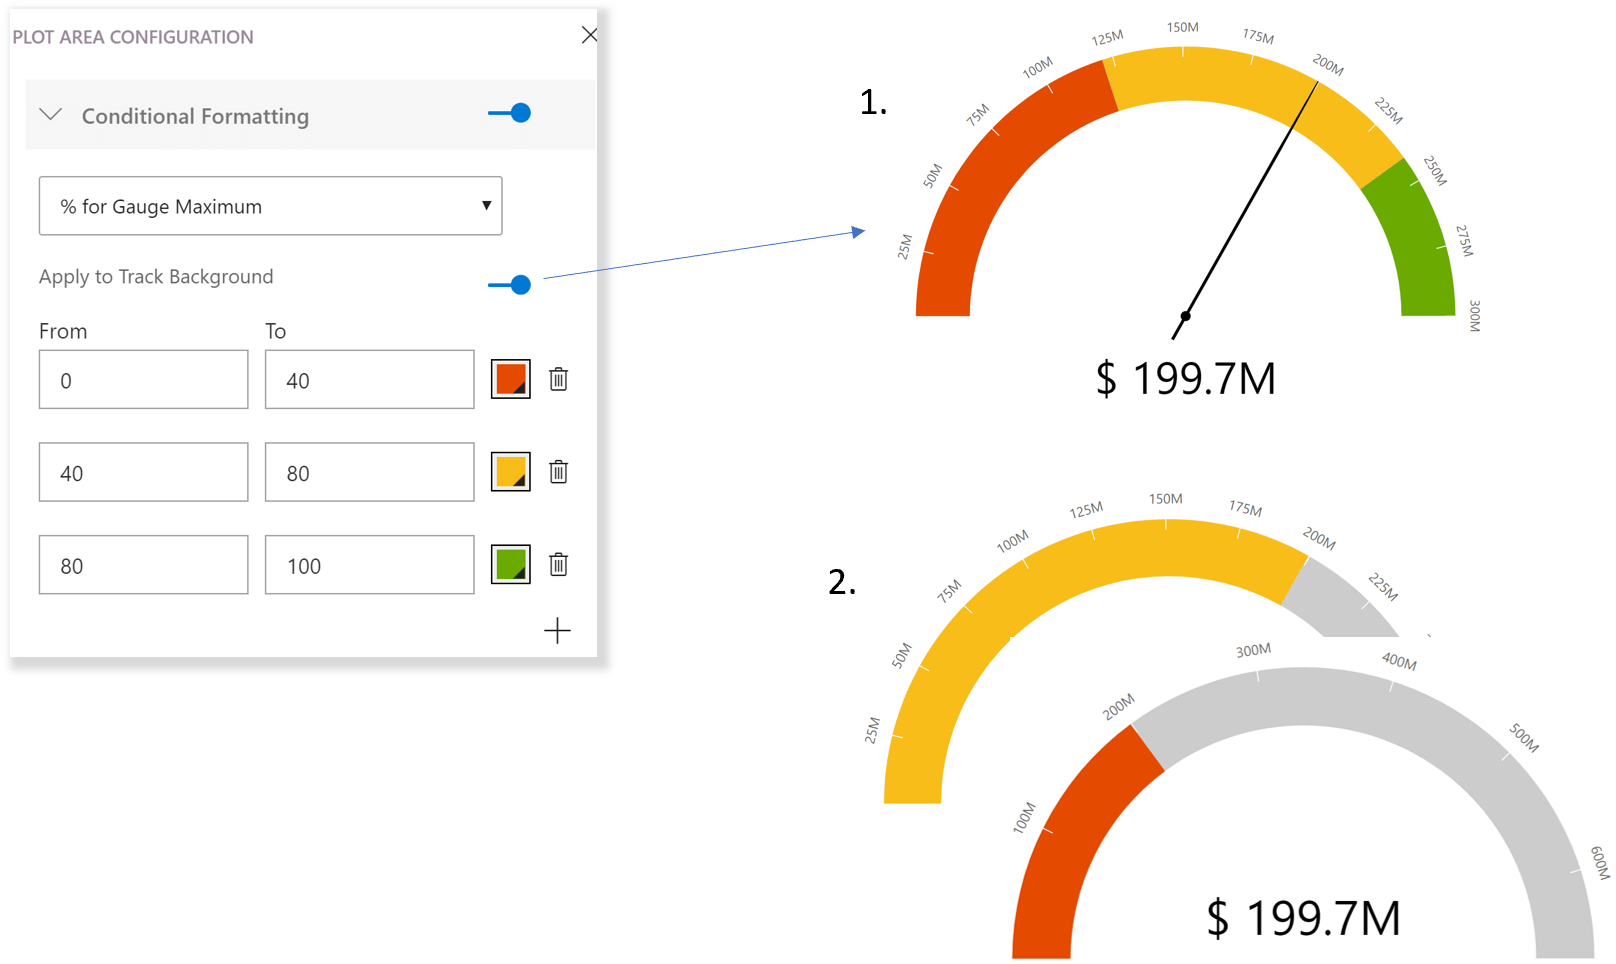
1. Advanced Gauge – a great way to represent a metric against a scale with optional qualitative representations illustrated by colors.

Microsoft features xViz in its Power BI Desktop Summary Blog for November 2019

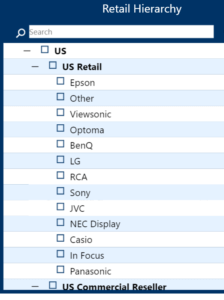
2. Hierarchical Filter – a selector component like a slicer, just that it can display multiple category values in an expandable tree view

Microsoft features xViz in its Power BI Desktop Summary Blog for November 2019

These visuals are a major integration with the rest of the Power Platform and enable key scenarios such as writeback and taking immediate data-driven actions on your insights.

Check out the insightful blog by Amanda Cofsky, Program Manager, Power BI for November 2019 here. For more information on upcoming custom visuals to the xViz Suite, stay tuned!

Click here to import the latest visuals to your Power BI.

You can take a look at the other advanced custom visuals by xViz here.

xViz
About xViz!
xViz is a leading provider of advanced enterprise-grade visuals for Microsoft Power BI. The powerful, intuitive, and customizable data visualization experience of xViz, maximizes the potential of the data and elevates analysis to new heights. This product is developed by Lumel Technologies (formerly Visual BI), which has a decade of experience in building add-on solutions on top of BI platforms (SAP BI and Power BI) with our suite of innovative products such as Inforiver, xViz and ValQ.
PBI Certified

Headquarters

5920 Windhaven Pkwy, #130
Plano TX 75093

Inforiver
ValQ
cross linkedin facebook pinterest youtube rss twitter instagram facebook-blank rss-blank linkedin-blank pinterest youtube twitter instagram