This blog is part of the Gantt chart Blog Series.
We are proud to announce the latest release of our xViz Gantt chart (V 1.1.6). Following is a quick summary of exciting new features added to as part of this release. You can also view the recent Webinar – How to Manage and Track Projects in Power BI using xViz Gantt Chart to get a quick understanding of how to configure or use these new features.
Latest Features – Summary
- Support for Ragged hierarchies (Filter blank)
- Fiscal Year
- Display Values for Parent nodes
- Conditional Formatting for a Parent node and Progress Bars
- Multiple Reference Lines
- Reference Range
- Web URLs
- Multiple connector lines configuration
- Data label enhancements
- Write back scenario
- Display Totals
- Date Timeline formats
- Zoom Levels
- Row numbering
- Locale support
Latest Features – Description
- Support for Ragged hierarchies – Filter blank
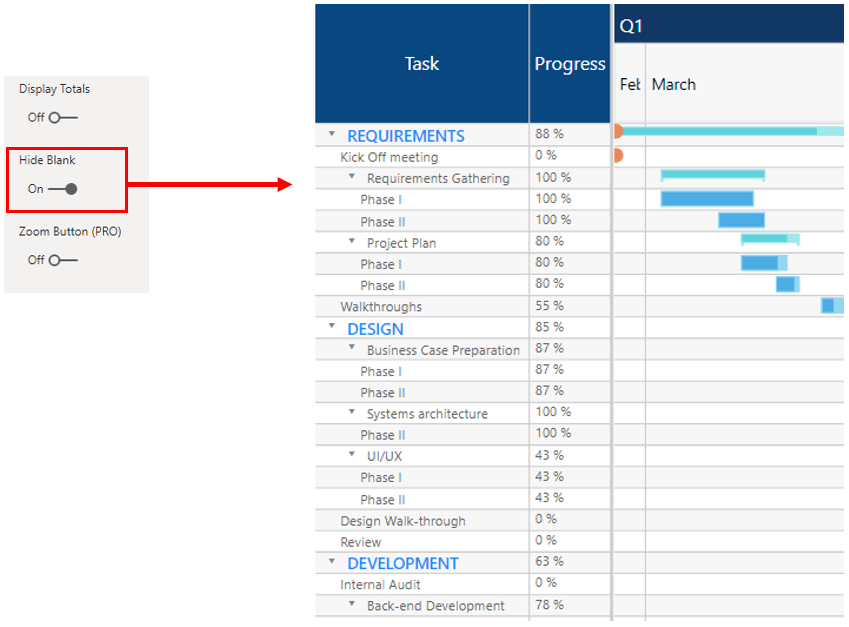
One of the typical scenarios you come across in Gantt charts is ragged(uneven) hierarchies where you find certain Top nodes much deeper than the other nodes. The xViz Gantt chart now provides the ability to hide blank nodes which appear in case of ragged hierarchies.
2. Fiscal Year
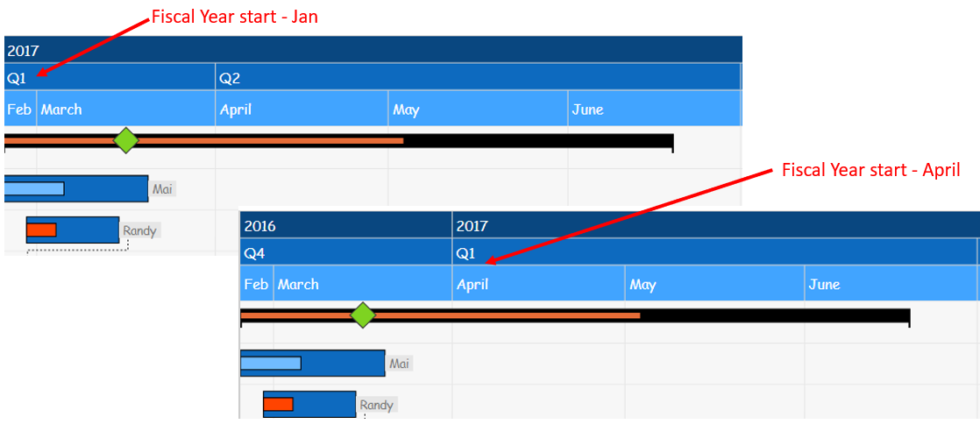
You can now configure different Fiscal year start based on your enterprise needs. As seen in the below example, both charts have a different fiscal year start, one starts in January and the other begins in April.
3. Display Values for Parent nodes
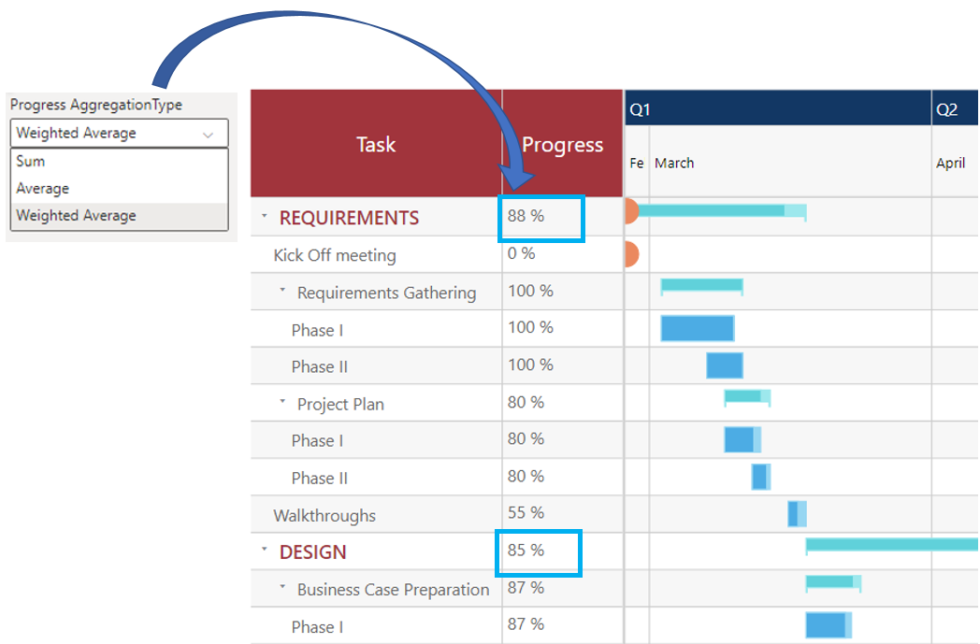
Values assigned to the ‘Display Measure’ field can now be displayed for Parent nodes as well. You can choose from different aggregation options – weight avg, average, and Sum under the Number Formatting tab to define the aggregation logic for parent nodes.
4. Conditional Formatting
The Conditional formatting Tab has been redesigning with new features and controls listed below for better user experience and project management.
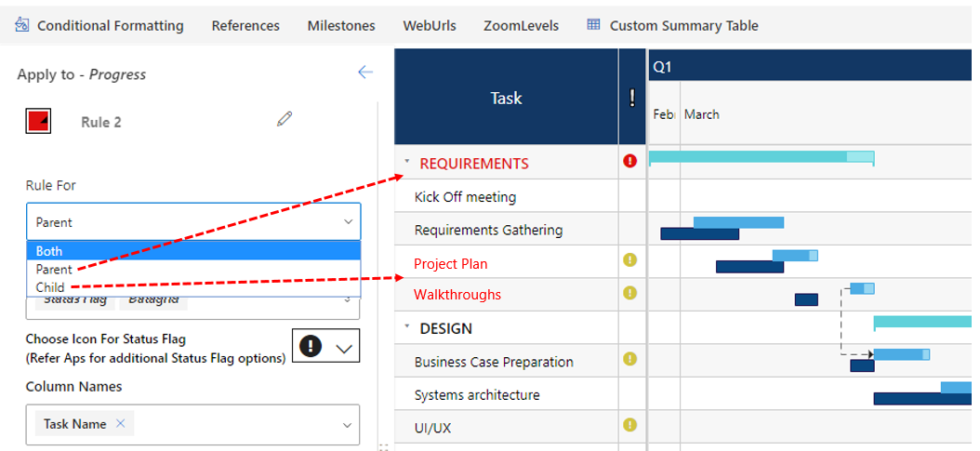
- Conditional Formatting for the Parent node
Unlike earlier release, you can choose between defining the conditional formatting rule based on parent, child node, or both nodes together. Setting Conditional Formatting on parent nodes makes it easier for viewers to visually highlight tasks where individual sub-tasks are off track and require their attention.
Conditional Formatting for Progress bars- Track, fill and both
Choose between different coloring options to highlight tasks based on conditional formatting rules. The new ‘Fill’ coloring option makes it easier to highlight a bar where there are no progress values (tasks which are yet to start or delayed)

5. Reference Lines
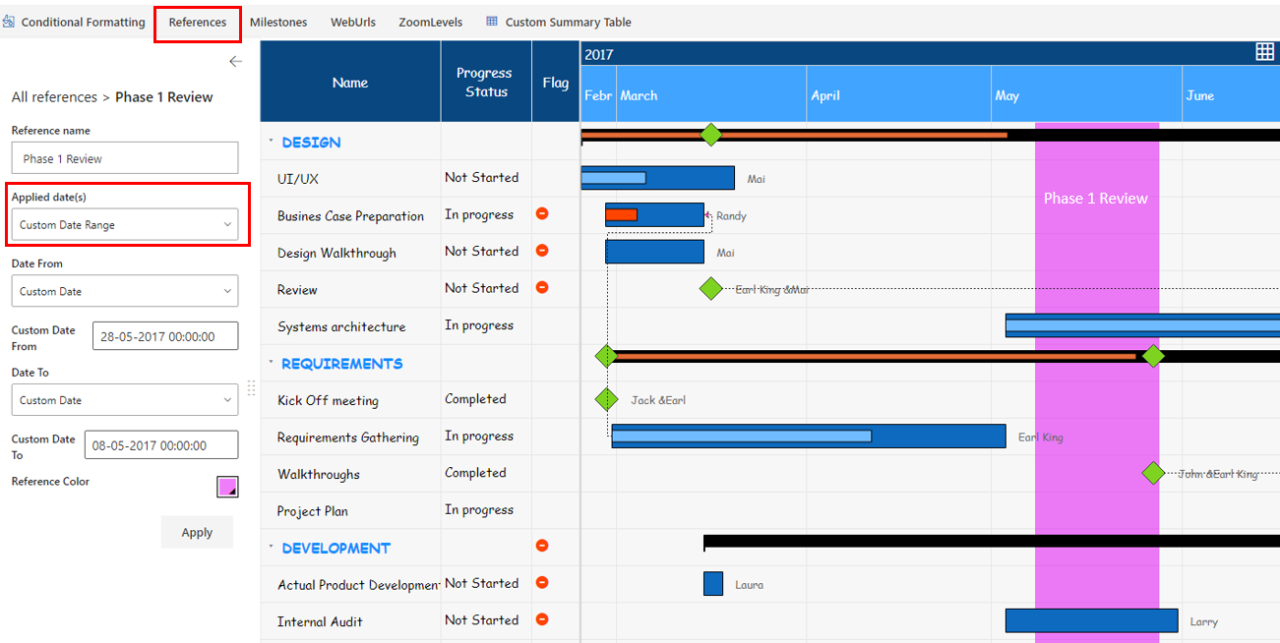
The Reference Lines feature has been moved to advance Editor Tab and has been completely redesigned to support Multiple reference lines and Reference Range -highlight a range on the Timeline
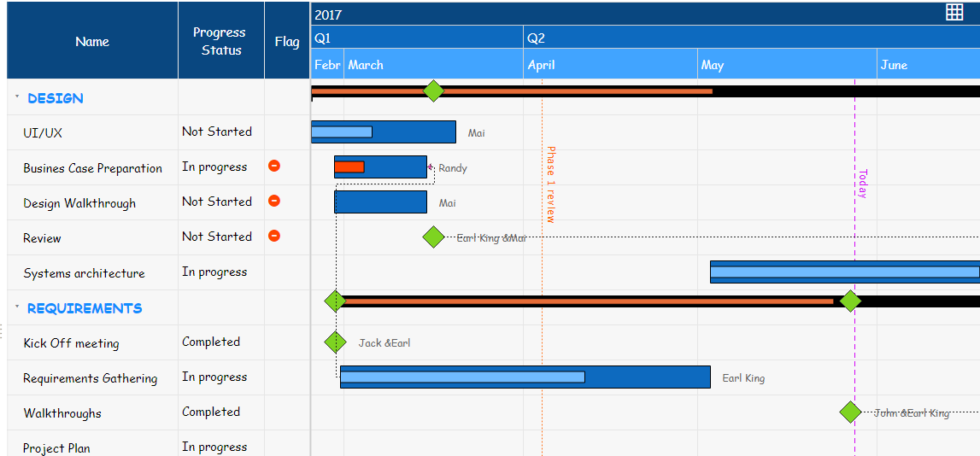
- Multiple reference lines – The xViz Gantt provides users the option to set multiple reference lines based on different logic –
- Today’s Date
- First of Date
- Last of Date
- Custom Date
Reference Range – Use the reference range option to highlight a specific range on your timeline
6. Web URLs
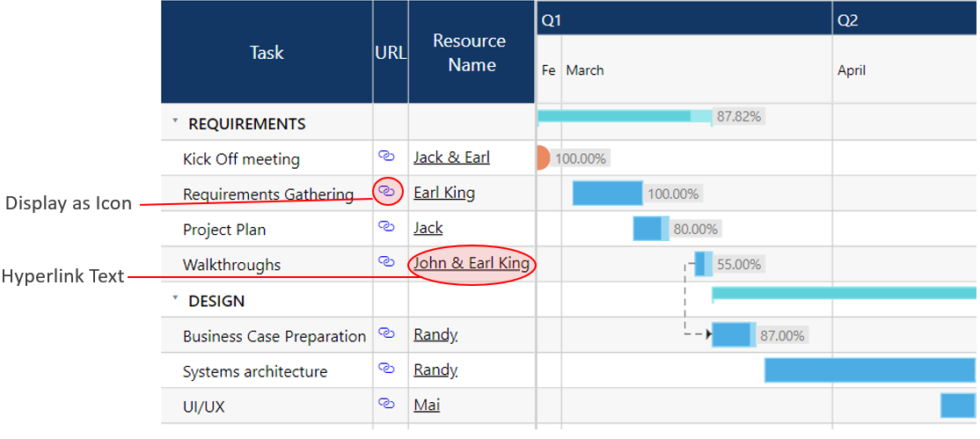
The Web URL Tab under Advance Editor provides different display options for long Web URLs which are as follows:
- Hyperlink Text
- Hyperlink Icon
- Web URL link
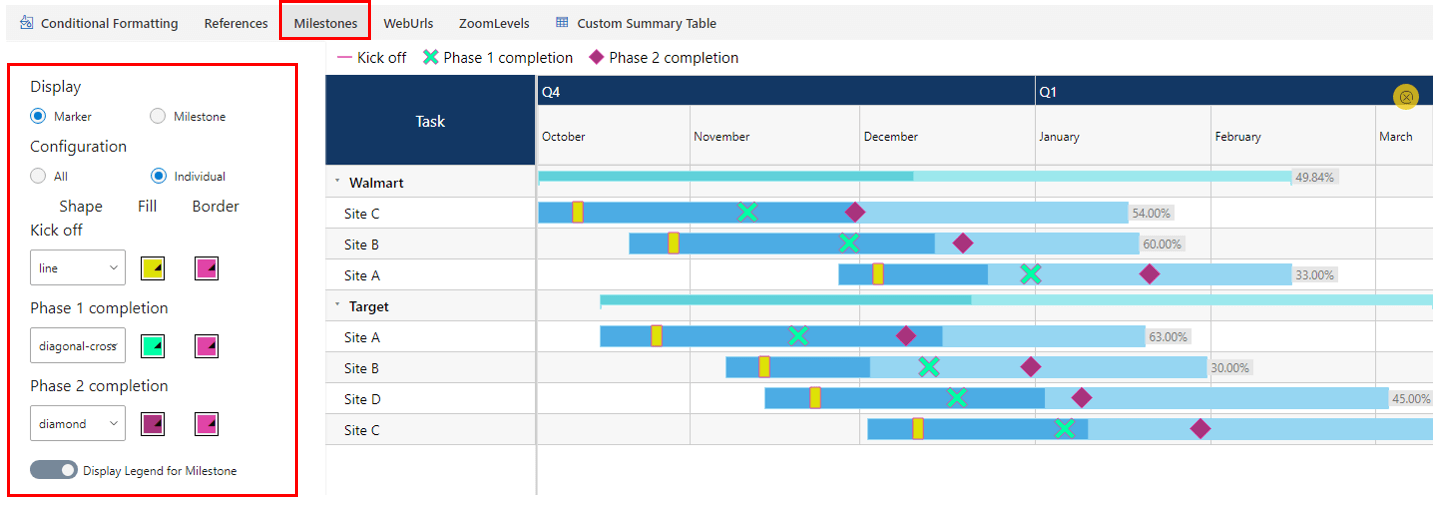
7. Milestone Moved to Advance Editor
The Milestone section has been moved to Advanced Editor to support some new Milestone customization options
8. Multiple connector lines configuration
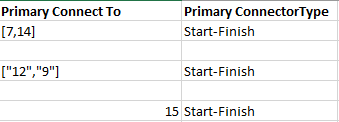
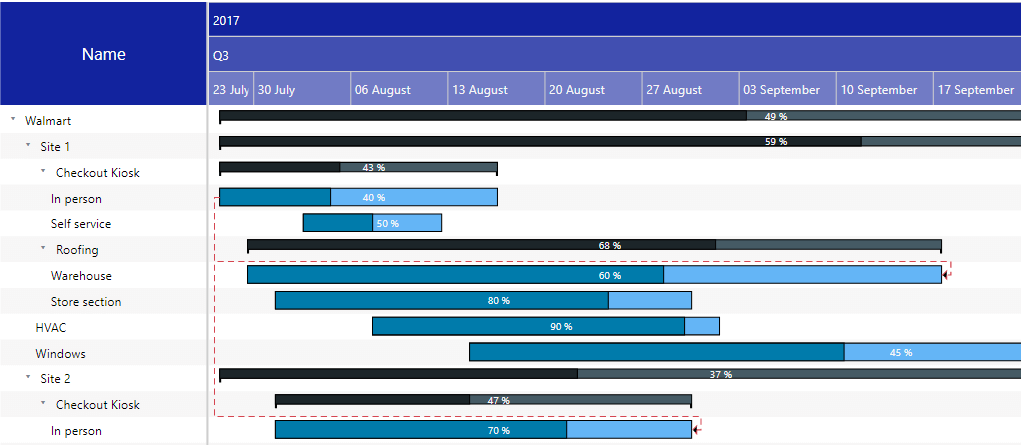
Unlike the previous xViz Gantt chart version, where you had to define a secondary connector type for more than one connector line display. Now you can use the primary connector field alone to display more than one connector line. For this, you would need to define the connector to field in the following format –
[“Task1”, “Task 2”] or if you have an ID field assigned to ID tab then you could also use ID – [Task ID, Task n ID]
9. Data label Enhancements
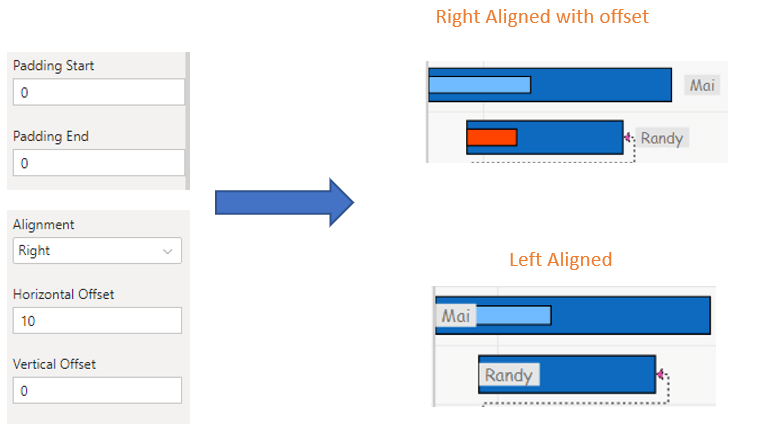
To address data label cut off issues for long data labels, a couple of new properties have been added which are as follows:
- Data Label Alignment – choose from right, left and center
- Offset – For better horizontal and vertical alignment
- Padding – alter Trimline padding to handle long labels
10. [Yet to be released] - Write back scenario
Along with the ability to make live edits to your Gantt chart on runtime, it now supports the Writeback option as well for enhanced project management. This way you write these new changes back to the underlying system. For more information on Write back for xViz Gantt Chart please refer to this blog
Note: You would need to request a custom build for the write-back feature which is part of only Gantt Enterprise offering.
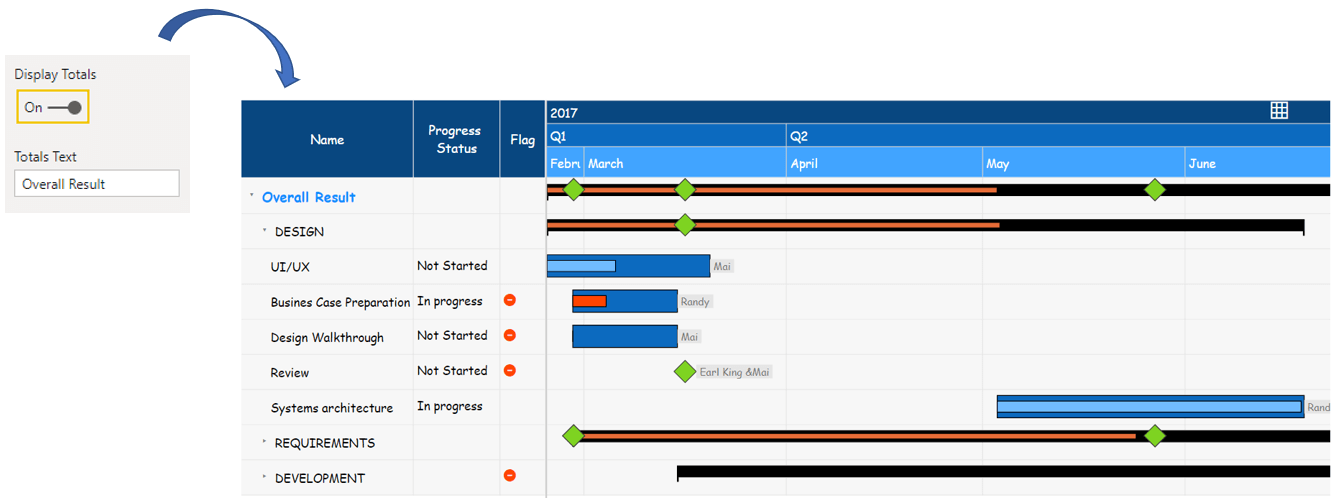
11. Display Totals
This property provides an Overall Total node overall parent and child nodes.
12. Date Timeline formats
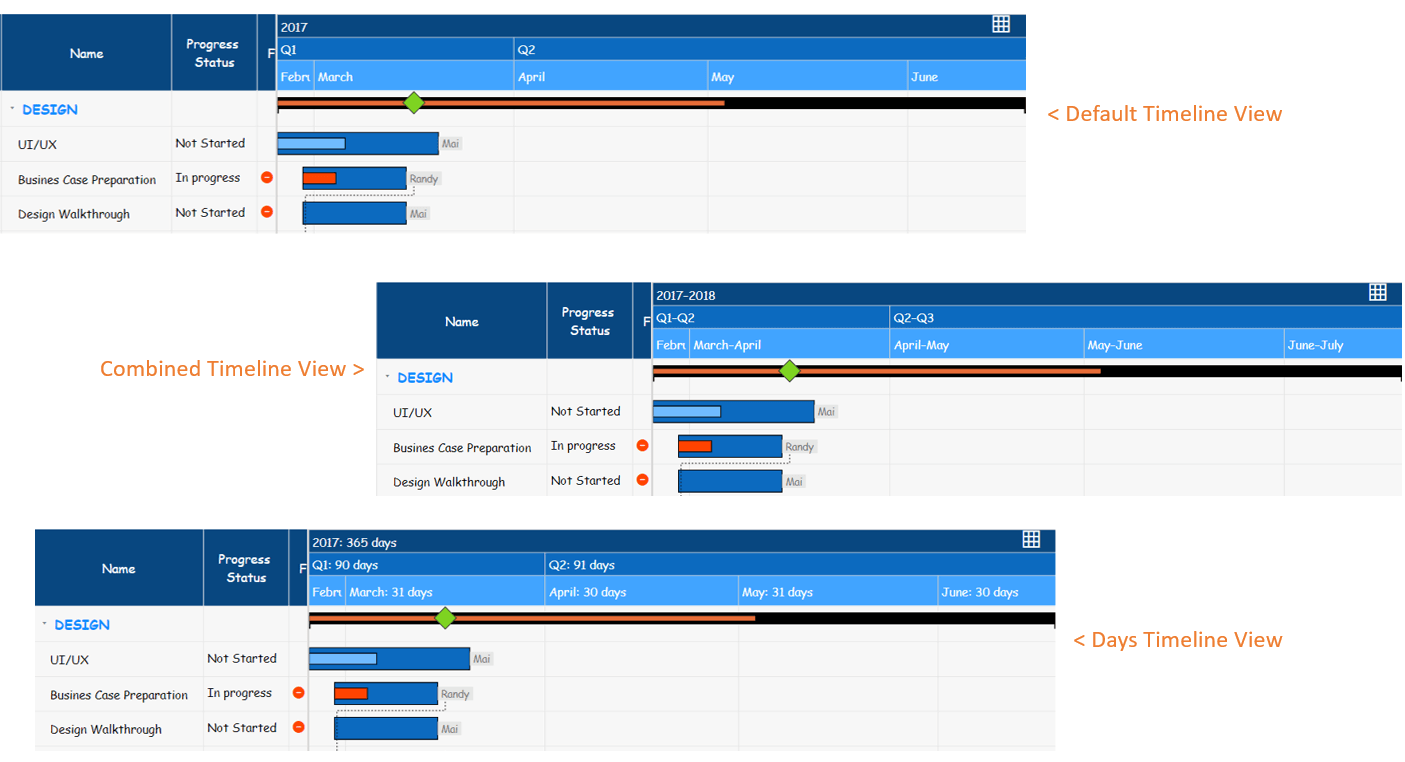
The xViz Gantt chart now provides different date formats for your timeline which are as follows:
- Default – e.g. Q1, Q2
- Combined – Displays combined time ranges together e.g. Q1-Q2, Q2-Q3
- Days – Displays the number of days in each time range e.g. Q1: 90days, Q2: 91 days
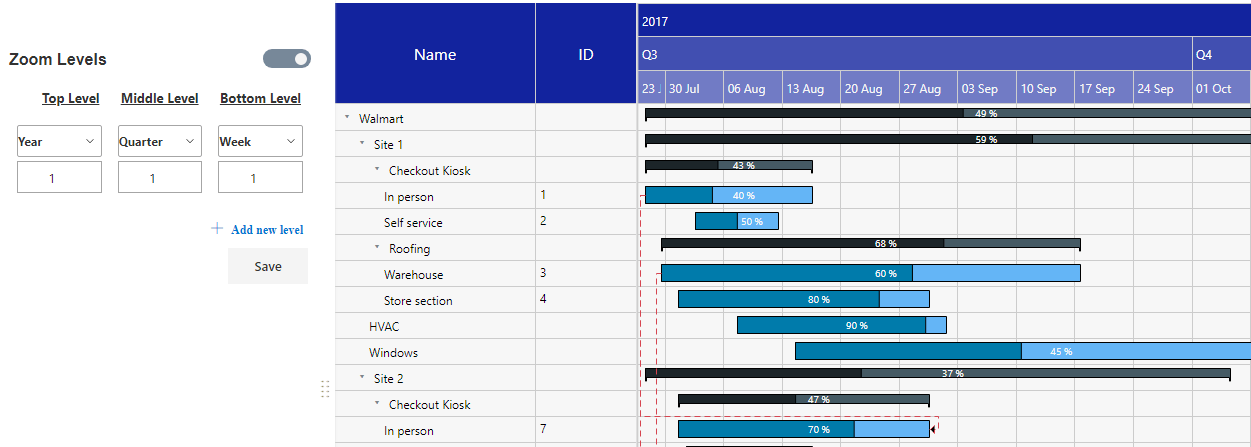
13. Zoom Levels
The zoom levels property under the advance editor tab provides the option to define the timeline levels you see while zoom in and zoom out the operation. You can at max set 9 different zoom levels and define different Top, middle and bottom levels based on user preference. As seen in the below, you can also skip levels – Month level is skipped and the bottom-most level appears as a week.
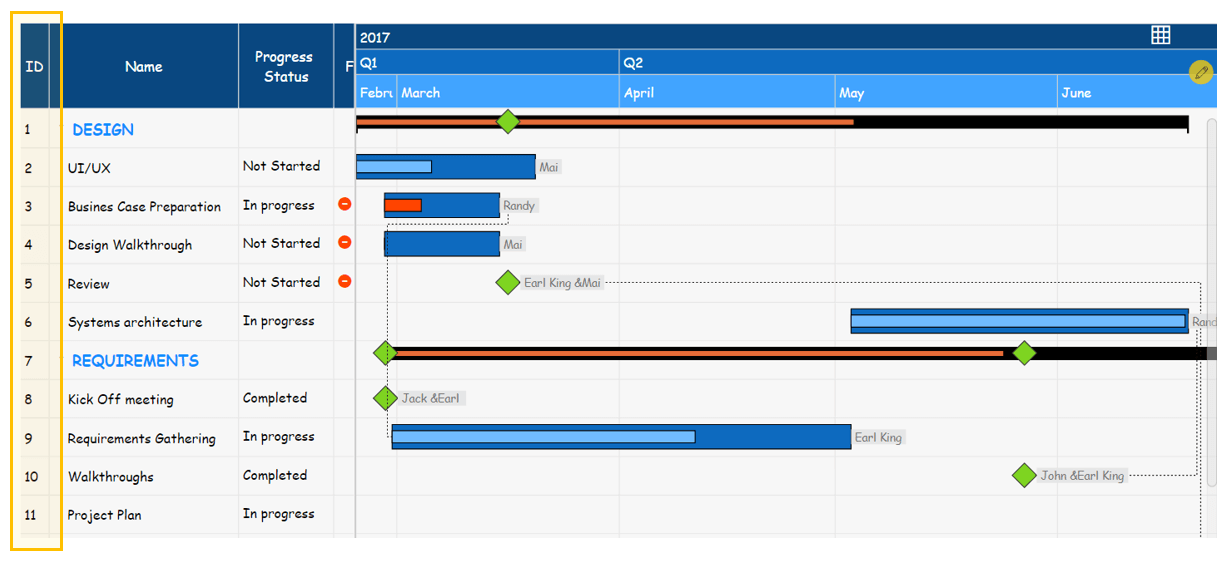
14. Row numbering (Enable ID)
As the name suggests, it provides a row number and can be found under the Display Categories Tab.
15. Locale support
The xViz Gantt chart provides language support for the following languages –
- German
- Spanish
- French
- Japanese
- Portuguese
- Russian
- Turkish
- Chinese

***
xViz Gantt Enterprise is no longer included in the xViz Pro Suite and is a separate product offering. Read more about the Gantt Visual Configuration, Key Features, and Use Cases here.

