This blog is part of the Gantt Chart Blog Series
Recently we released the Gantt Chart as part of the xViz suit and one of the common requests we got from customers is that they would like to build a sample Gantt chart similar to the ones listed in the previous blog – 5 use-cases for Gantt Chart.
I would like to thank all for your constant feedback and ideas to build a better product. There are a lot of different use cases and ways to customize the Gantt chart. In this blog, we are going to focus on how to configure a simple Gantt chart.
You could download the Sample Data for the Gantt chart and follow the below steps:
Steps to Configure Gantt Chart:
- Connecting the data to the Chart
For displaying a simple Gantt Chart all we need is the following fields:
- Task name – Here you can assign single or multiple categories. You can create a hierarchy structure by assigning multiple categories as task name
- Actual Start and End Dates – To Display the actual dates for the task
- Planned Start and End Dates(optional) – To display planned dates for the task
- Progress – Value to indicate the percentage completion for the task
- Display Category and Value – To display additional category or value columns to the data grid
2. Chart properties and Display Category and Measure section
After assigning the data, the next step is to choose the chart type and customize some of its related properties which are as follows:
- Chart Type and display – Gantt or Gantt Resource. In case of Gantt chart one can also customize the Progress bar Display to be either bar or bullet
- Runtime Zoom option – For end users to customize the zoom level if required
- Display category and measure – Set the width and name for each of the additional columns in data grid
3. Data Grid
- Background and Font color, Font style – Apart from styling the data grid items and header, you can also style the parent node independently. Thus, making it stand out from the child nodes in case of a hierarchy.
- Collapse All node – Collapse or expand nodes to the desired level
4. Timeline
The timeline section provides formatting capabilities like font and background color, the font size for each of the header levels along with a bunch of other functionalities which are as follows:
- Zoom Range – Set the default zoom range at design time for better viewing
- Reference line – Reference line for today’s date with line styling and text option

5. Data Color
The xViz Gantt chart provides several different options to set the color for the task bars.
- All – Set a common color for all Parent and child nodes together.
- Parents – Set the color based on parent nodes. Where each parent nodes can have a different color to indicate a different task type and children nodes take up the parent’s color.
- Individual – Set the color individually for each task
6. Alerting
The Gantt Chart provides 3 different ways of alerting or highlighting an outlier. For this, you would need to set up different rules or conditions which are done using the advanced editor property which is common to all the different alerting types. The different alerting types are as follows:
- Conditional formatting
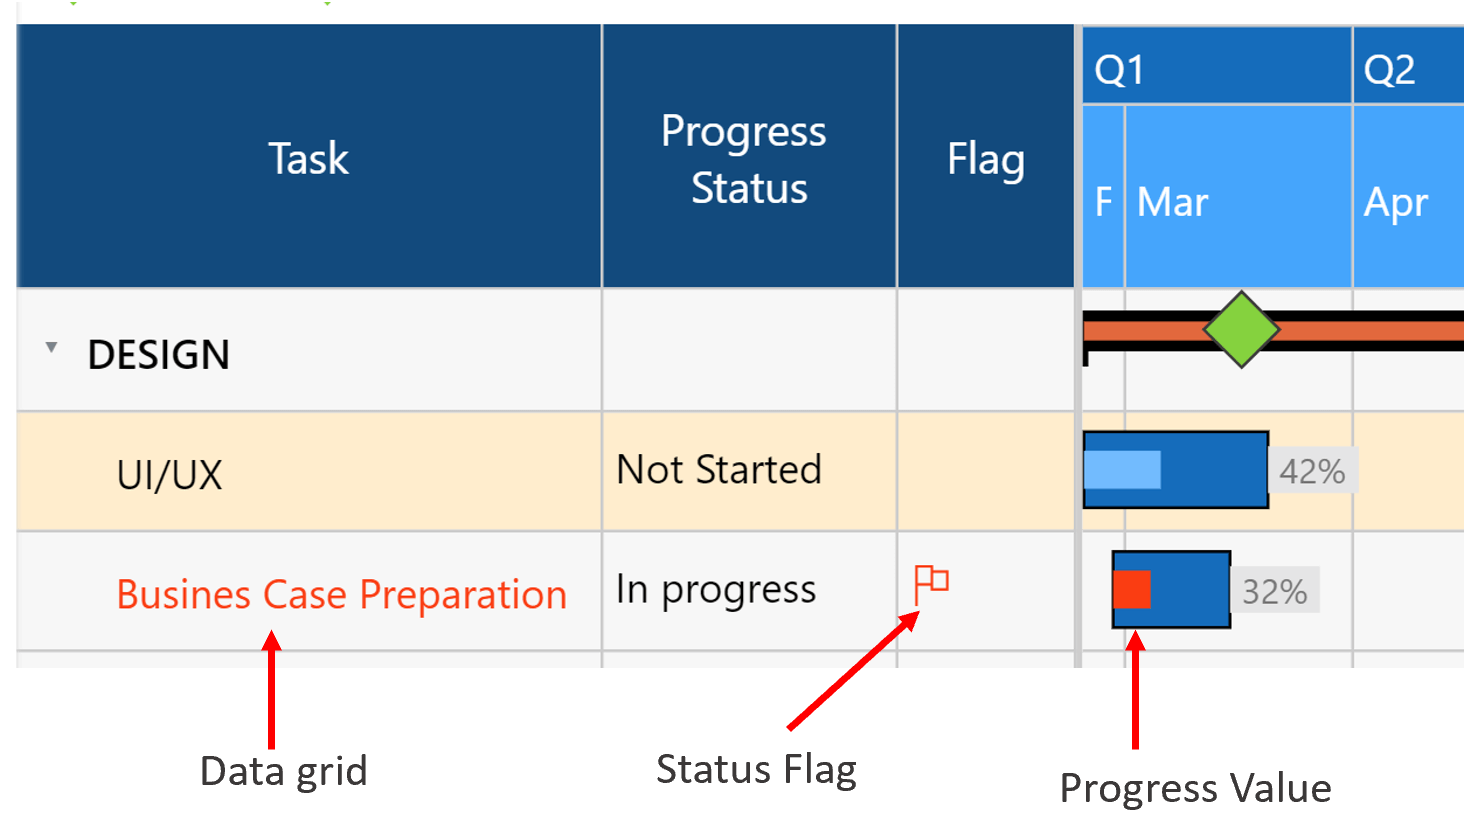
- Status flag
- Data Grid
7. Milestone
The Gantt Chart sets milestones automatically based on the data provided with different formatting options like color and shape. Instead of the chart displaying the Milestone automatically, you may also assign a separate filed to do so.
The Marker Type field provides advanced customization options where you can set up different marker shapes and colors based on a category field.
8. Primary and Secondary Connector Line (aka Dependency Line)
Certain tasks in a project are dependent on other tasks such that their start or end of one task affects the execution of the other task. For example, you would start with a testing phase for software, only after the development is complete.
Connect To – It specify the task to which this task is linked.
Connector Type – It specifies the relationship between the two tasks. The different connector types are as follow:
- StartStart – Start at the same time the predecessor starts.
- StartFinish– Finish before the predecessor starts.
- FinishStart– Start after the predecessor finishes.
- FinishFinish– Finish at the same time the predecessor finishes.
9. Data Label
By default, the xViz Gantt Chart displays the progress value as a data label in case of a simple Gantt and task name in the case of the Gantt resource chart. However, this can be overridden with a different value or category field by assigning the desired value in the data label field in the fields pane tab.

In the next blog, we will see how to configure a Gantt Resource Chart. So stay tuned!
***
To get the latest version of the custom visual, reach out to us here.
You can take a look at the other advanced custom visuals by xViz here.