This blog is part of Gantt chart Blog Series.
Since our last release in December 2019, we added some new exciting features to our xViz Gantt Chart. Following is the list of the top features added to our xViz Gantt Chart for Power BI:
- Progress Bar Display
- New Alerting options
- Different Milestone Types and Legend
- Additional columns formatting (both Category and Value)
- Parent Node Styling
- Additional field for Data Label
- Live editing
- Data Colors
- Summary Table
- Connector Line Style
For the Latest Feature Updates to xViz Gantt Chart Power BI Visual, check this blog out!
Features – Description
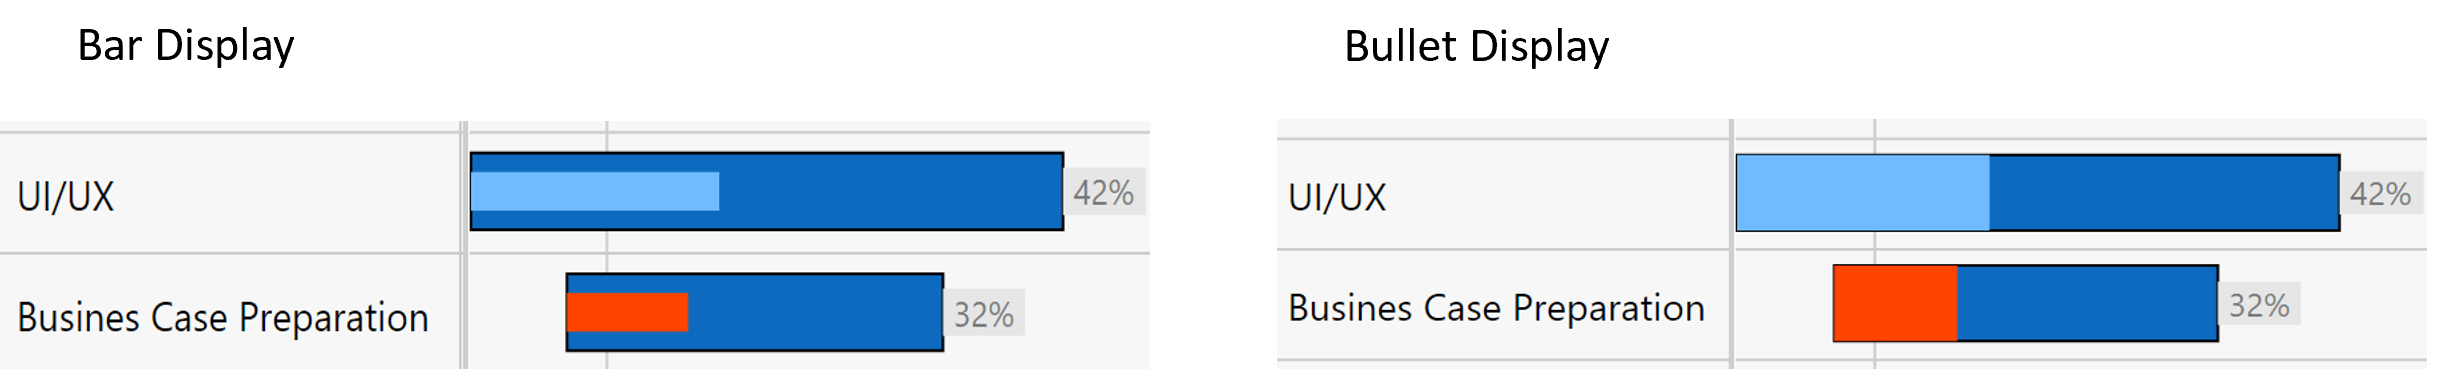
- Progress Bar Display
An additional option to customize the progress bar display type has been added. You can choose between a bar or bullet display for your chart.
Note: This feature is only available for chart type Gantt and not Gantt Resource.
2. Alerting Options
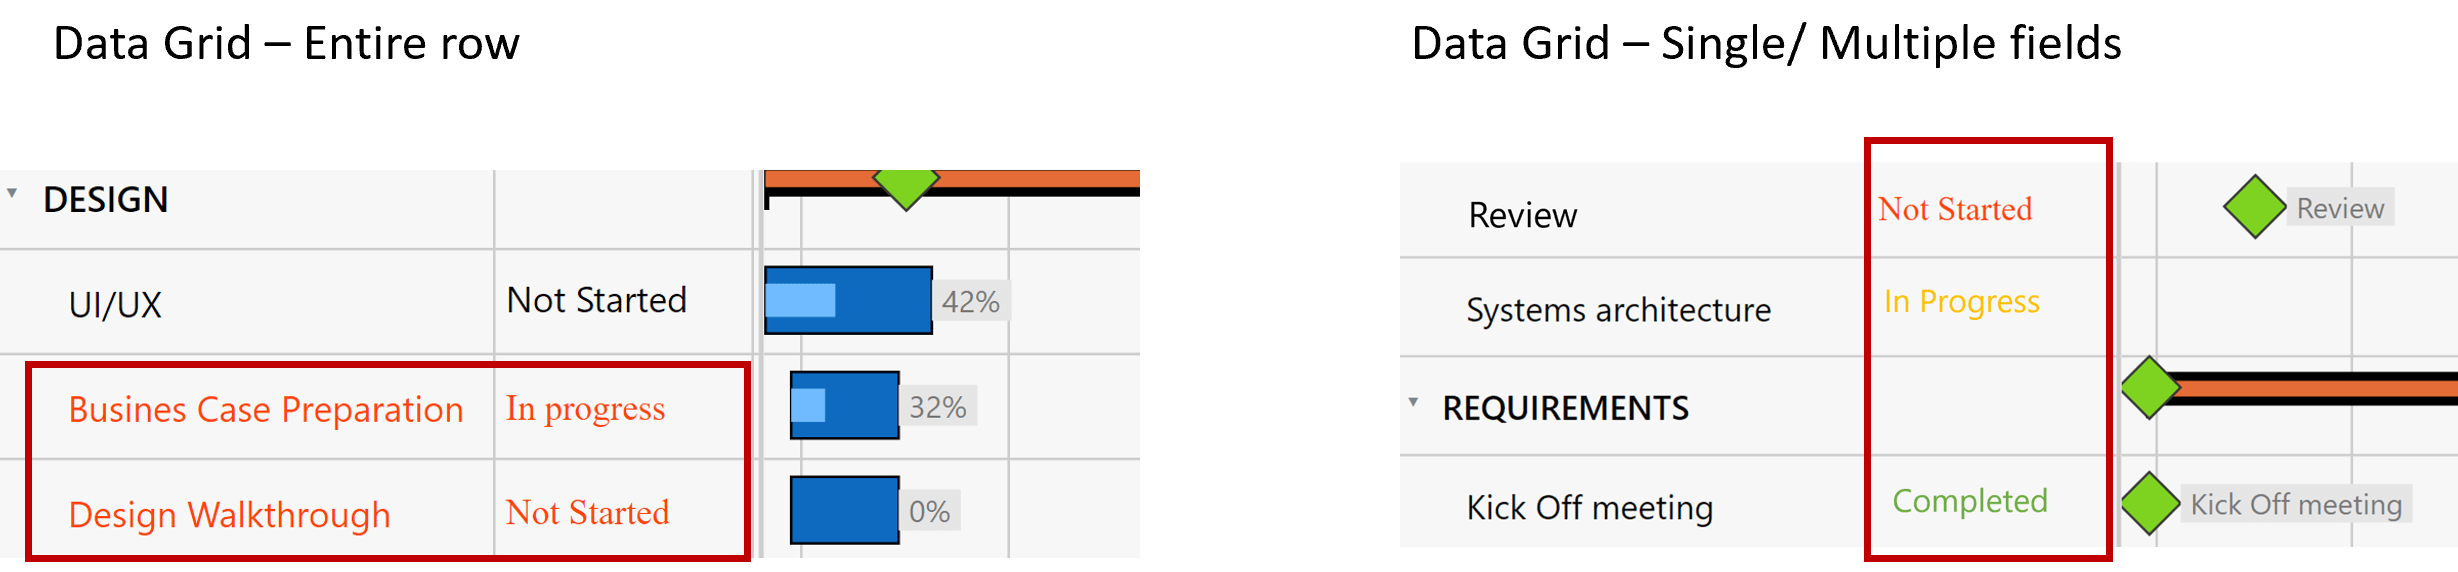
- Data Grid as a new alerting option – Along with setting the status flag and conditional formatting the progress bar, you can now conditionally format your data grid as well, based on the same rules. The conditional formatting can be done for an entire row or specific columns.
The Apply to alerting section has now been moved to the Advance editor for ease of use. This means that you can now choose between different alerting options right in the advance editor without the need to move back and forth between the Additional property sheet and Advance editor. The following are the different available options for conditional formatting:
a. Status Flag
b. Progress Bar
c. Data Grid
d. Status Flag and Data Grid
e. Status Flag and Progress Bar
f. Progress Bar and Data Grid
g.All
Additional icons for Status Flag – Choose from a galore of options for icons with the ability to search and quickly navigate.

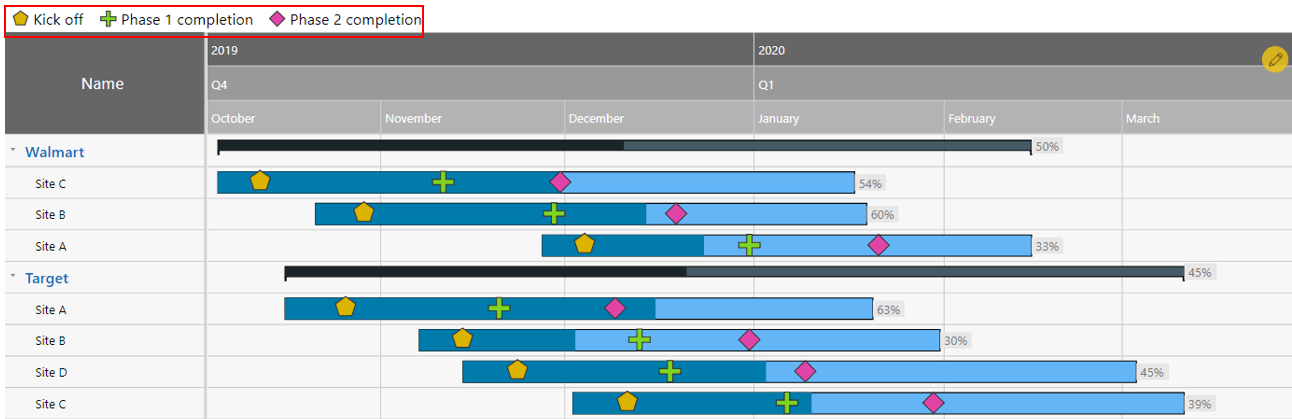
3. Milestone Enhancements
We added another use case for Milestone where you can now assign different marker types for different types of Milestone and have multiple milestones in the same row or task.
4. Additional columns (Category & Value) formatting
For better control of the width of the additional columns, you can now set the width of each of the additional columns along with the ability to rename them. You can also choose to hide them and use the field for conditional formatting if desired.
5. Parent Node Styling
Style the parent node (Level 1 only) separately to make it stand out from the child nodes for better readability.
6. An additional field for Data Label
The xViz Gantt Chart by default displays the progress value as a data label. However, this can be changed by assigning a separate field to the data label section in the fields pane which can either be a category or a value field.

7. Live editing
You don’t need to go back to source data to make changes as this feature provides you with the ability to edit your Gantt chart on the fly. The changes are reflected in the summary Table and these changes can be bookmarked and saved. Also, you can undo it with the little refresh icon as seen on the top timeline header. We will be updating this to provide you more capabilities in the later release. So stay tuned.
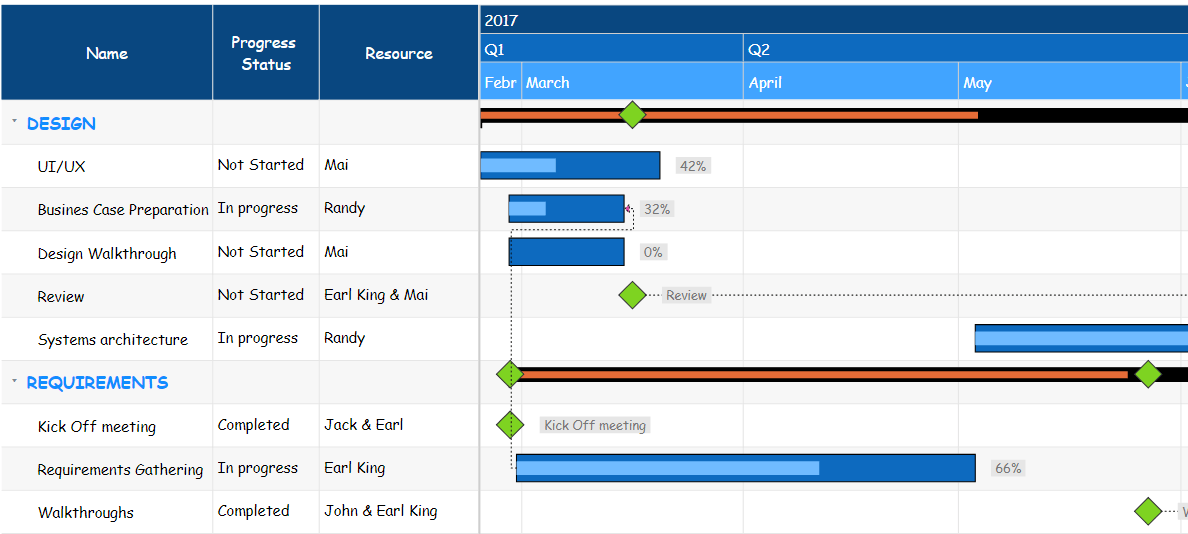
8. Data Colors
Some more flexibility has been added around the coloring options where you can set colors based on specific scenarios. Following is the list of different rules or scenarios to set the colors for the Gantt chart.
- All – All parent nodes have the same color(black and orange) and all child nodes have the same color(dark and light blue)
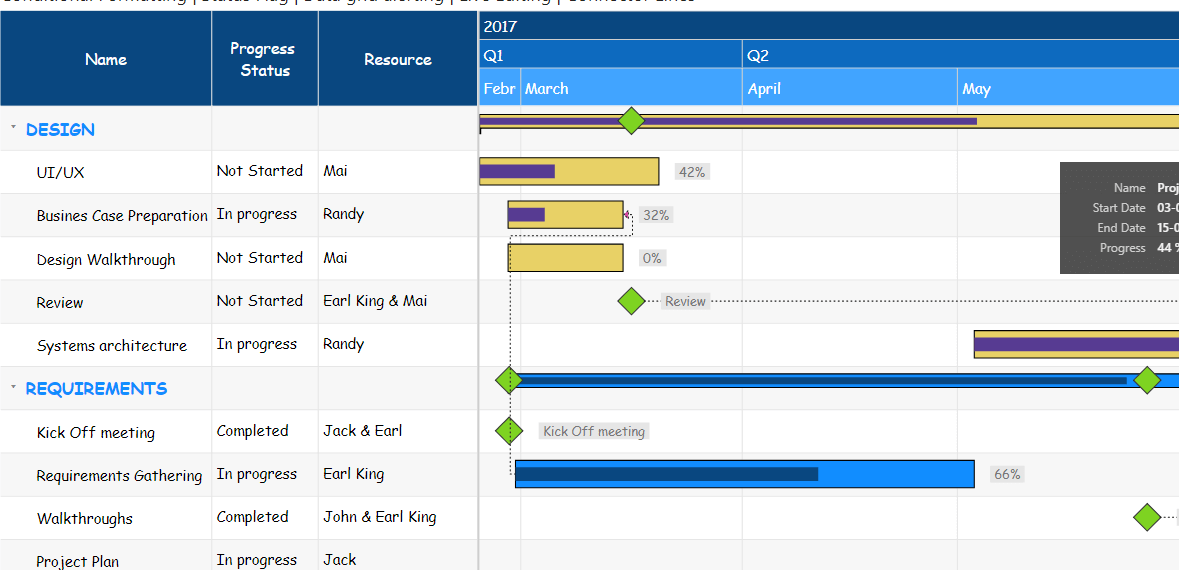
Parent – Each parent node can be assigned a different color and the child node follows the parent e.g. All the tasks (Parent+ children) for Parent A are in yellow and purple and all the tasks (Parent+ children) for Parent B are in blue color
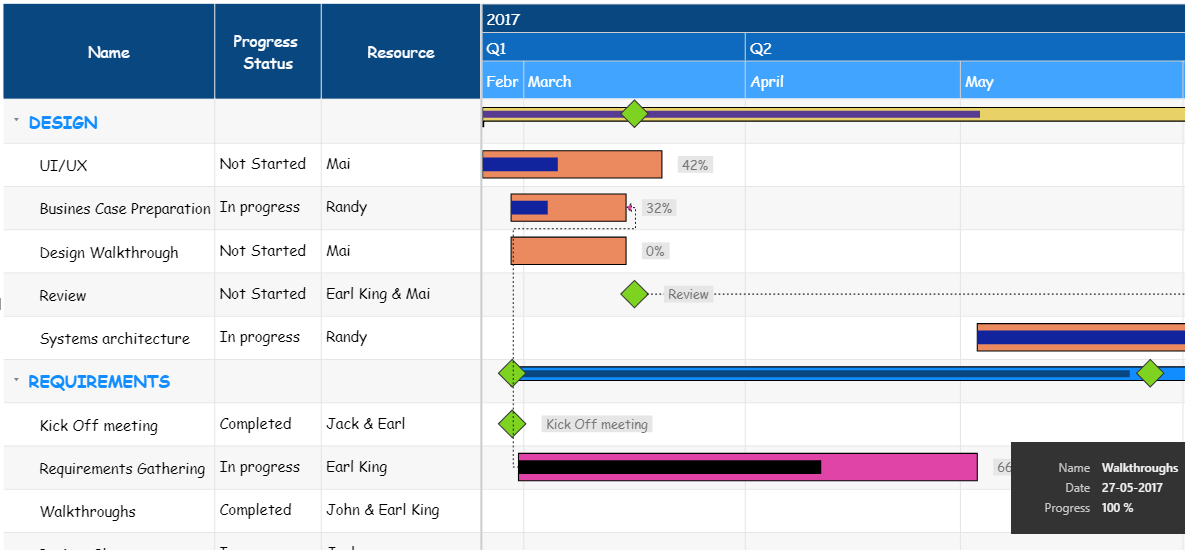
Parent-Child – Here you can customize the color for each parent and child separately.
9. Summary Table
Just like the other xViz charts, the Gantt chart has been provided with a summary table option. This way customers can quickly toggle between the chart and tabular view for more detailed information.
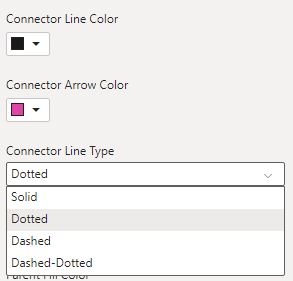
10. Connector Line Style
Additional styling options for connector lines aka dependency lines have been added. So, you can now choose a style for your line and the arrow color.
***
To get the latest version of the custom visual, reach out to us here.
You can take a look at the other advanced custom visuals by xViz here.