Yes, you heard it right! We added a new type of Linear Guage option. – ‘Progress Bar’ for broader coverage of different use cases for gauges. Following is a quick summary of exciting new features centered around the Progress bar for xViz Linear Gauge (v 1.1.5)
New Features
- New gauge Type progress Bar
- Custom Data Labels
- Tier Label
- Tier Limits
- Horizontal and Vertical orientation
- Conditional formatting enhancements
- Data Label enhancements
- Axis label formatting – scaling, show Nth label
- Gauge width and margin for better label positioning
Features – Description
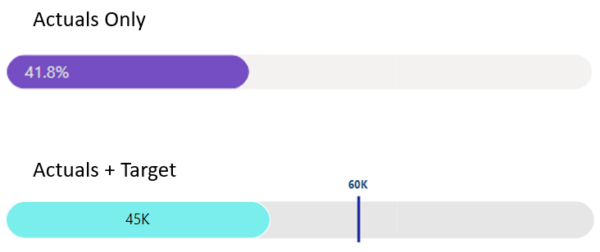
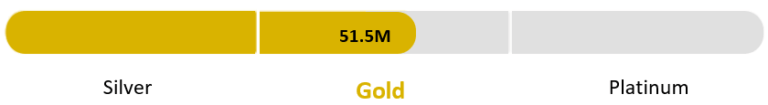
- Progress Bar
As the name suggest, Progress Bar is ideal for tracking progress towards a goal or a target value. You can display actual value in absolute, percentage or both formats.
Please note that unlike the Linear gauge the Progress bar does not support conditional formatting
2. Custom data Label
You can label each band or segment under the Custom Data labels Tab with the ability to highlight and customize the active band label. For example, categorizing customers into different loyalty programs based on purchase history
Please Note: Custom data labels, Tier labels and limits are only supported for Progress bar gauge option
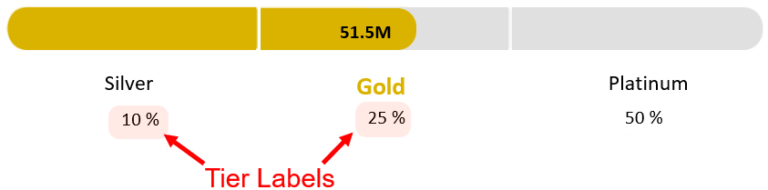
3. Tier Label
Apart from custom data labels there are a few scenarios where you would want to add additional labels for each band. This can be done by assigning measure values to Tier labels. For example, customers in Gold Tier are eligible for 25% discount on Totals sales .
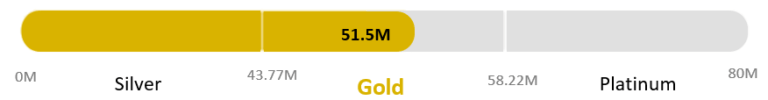
4. Tier Limits
Tier limits define the range for each of the bands. The scaling for these labels can be customized from the Axis Tab
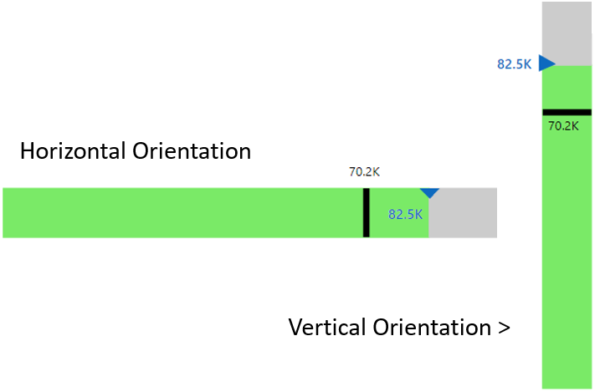
5. Orientation
You can now choose to flip the chart vertically or horizontally for both the linear and progress bar chart types.
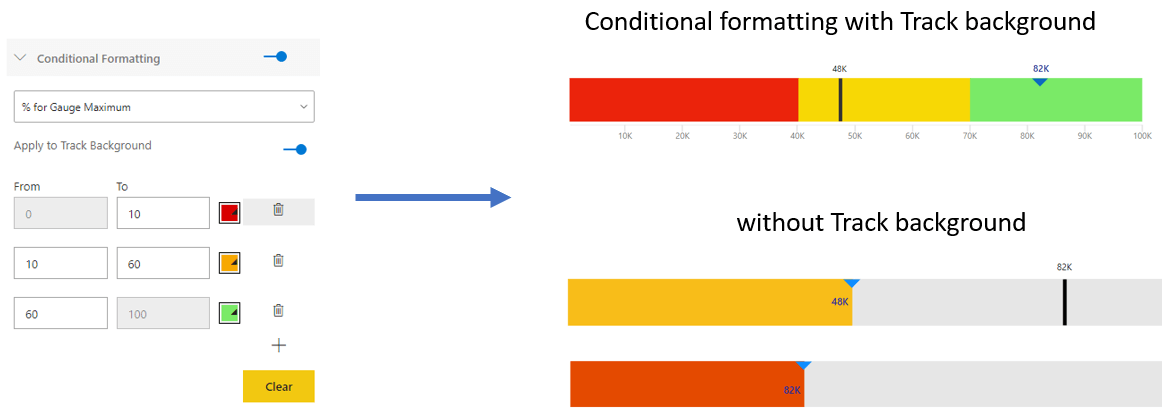
6. Conditional formatting enhancements
For a unified experience across both the gauges, the conditional formatting Tab has been moved to the Advanced editor section. The Linear Guage conditional formatting supports the following 3 scenarios –
- Color ranges based on Percentages of Maximum value
- Color ranges based on Percentage of Gauge Target
- Color ranges based on Static value
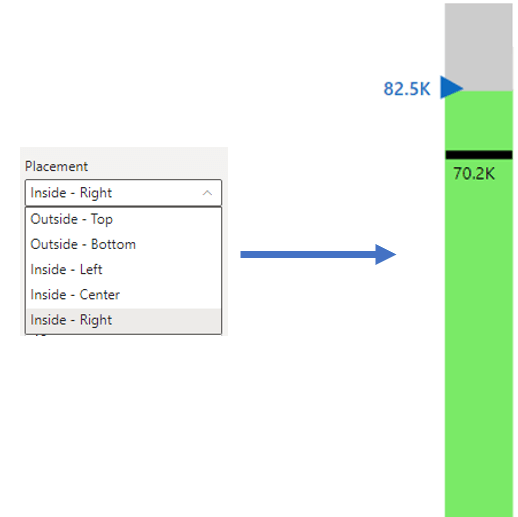
7. Data label enhancements
a. Data label placement options
For easier and more accurate data label positioning, you now have dedicated data label placement options based on chart orientation.
b.Label Display
For progress bar, you can choose to display Actual value as absolute, percentage or both together,

c. Label customization specific to series
Unlink the earlier version of xViz Linear Gauge each value can be individually customized for better chart readability and aesthetics. Properties which can be individually configured are as follows:
- Label value
- Label Placement and offset
- Text- Font color and weight
- Background color and transparency

8. Gauge width and margin
Gauge width and margin have been added to the Gauge properties Tab for better control on gauge width and positioning of the linear gauge
***
Get your xViz Suite for Power BI Desktop with all the pro features unlocked here.
Learn about all the advanced Power BI Visuals offered in the xViz Suite here.