Advanced Gauge is a great way to represent a metric against a scale with optional qualitative representations illustrated by colors. They are also sometimes referred to as a speedometer or tachometer chart and are most commonly used to measure values like volume, temperature, speed, etc.
The Advanced gauges are good for following use cases:
- Display the health of the KPI with the help of the qualitative scale
- Show progress toward a goal.
- Display simple information that one can quickly scan and understand.
The xViz is an enterprise-grade custom visuals suite exclusively for Microsoft Power BI. In case you are not familiar with our visuals yet, you can find some introduction material here. The xViz suite consists of 2 types of gauges-
Now, let’s look at some of the use cases for Advanced gauge using xViz for Power BI
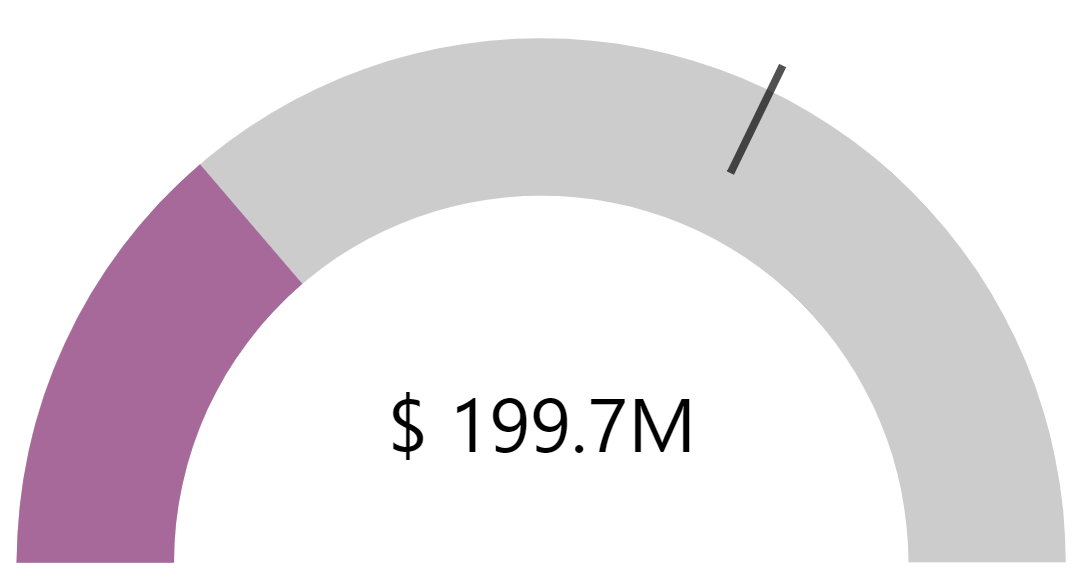
Single-axis with Target Value
The most common use case of the Advanced gauge is to not only view the actual value on the scale but also compare it against the given target. With xViz Advanced gauge for Power BI you can both assign a measured value as part of the fields tab or enter the desired target value as part of the chart properties field. Further, to increase the chart accuracy and make it ready for dynamic scenarios. You could also assign a chart min and max value either using the fields Tab or by entering the desired value in the chart properties.
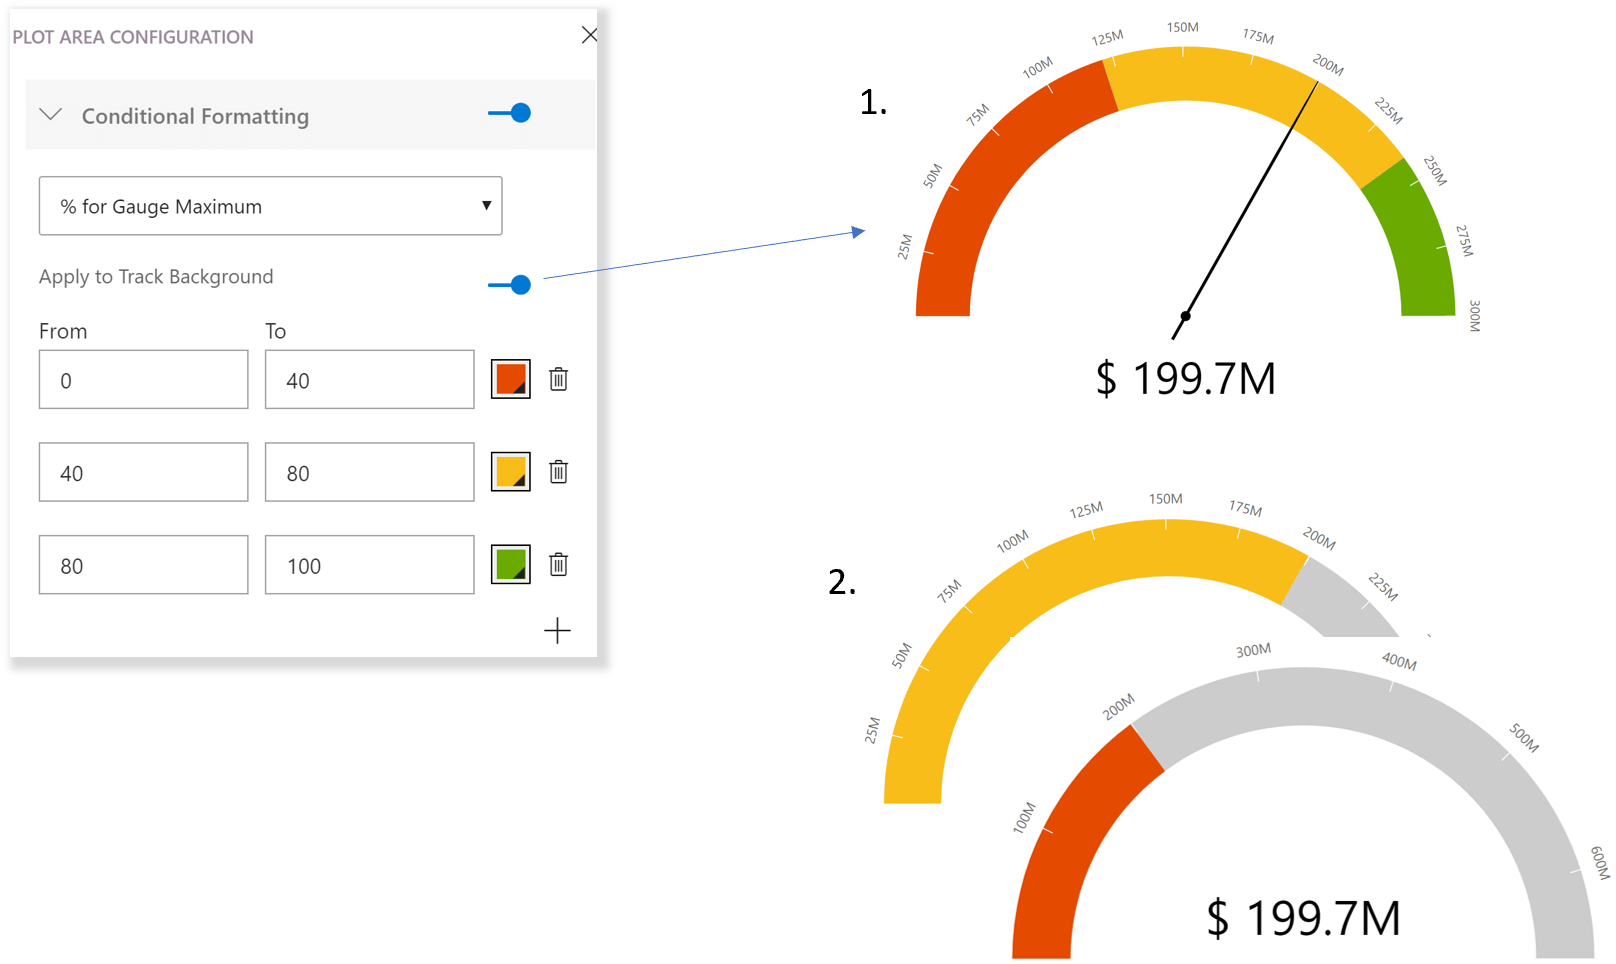
Conditional formatting
Another commonly used property is conditional formatting which helps in visual alerting and conveys the state of the KPI whether it is doing good or bad. There are 2 ways in which you can configure the conditional formatting – first, you can apply conditional formatting to the axis scale (fig 1), or second, you color code the fill area (fig 2) which would dynamically change color on reaching a certain set threshold. Based on the values provided to the chart, the conditional formatting can be set based on the following –
- Percentage of Gauge Max value
- Percentage of the Gauge Target value
- Value – User-defined absolute value
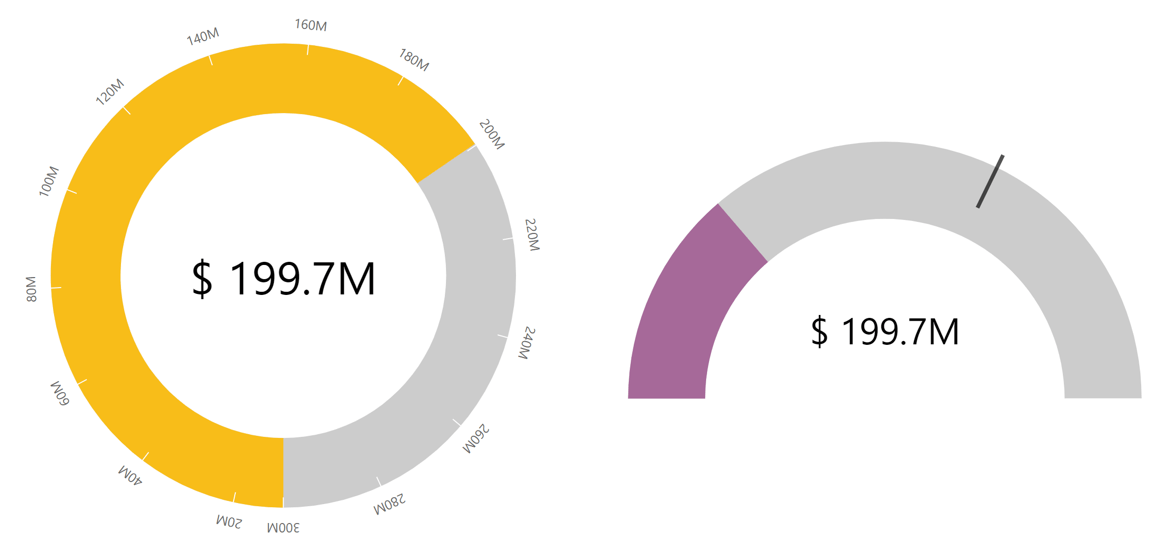
Semi-circle or full dial
Depending on the use case and real estate available the user can customize the type of Gauge required. In case you were wanting to use it for measuring gross margins for your business, you would prefer using a semi-circular gauge where the axis range is limited. Whereas, in case of a speedometer you would prefer using a circular gauge where you have a wider range of values.
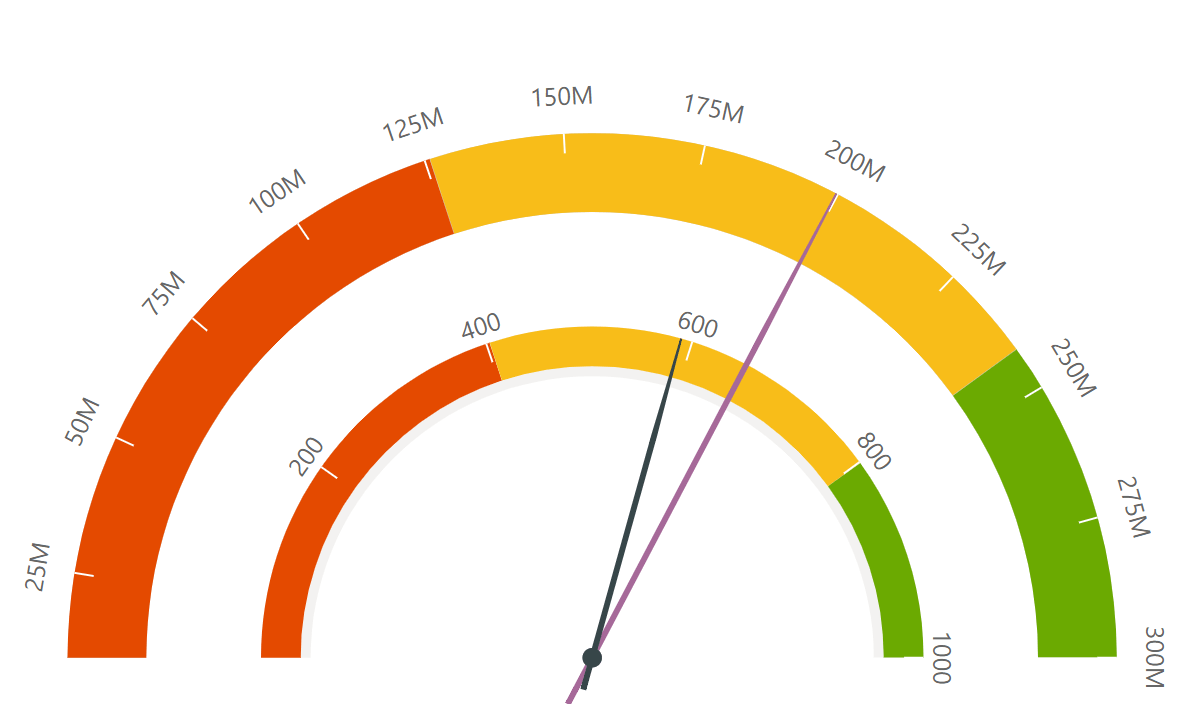
Dual Axis
In case you would like to measure more than one KPI, especially when both the KPIs are closely linked like Sales and Avg Selling Price of the material. You could use a Dual Axis Gauge.
Just like the primary axis, the secondary axis has the same properties, where you can assign the Actual, Target, Min and Max values
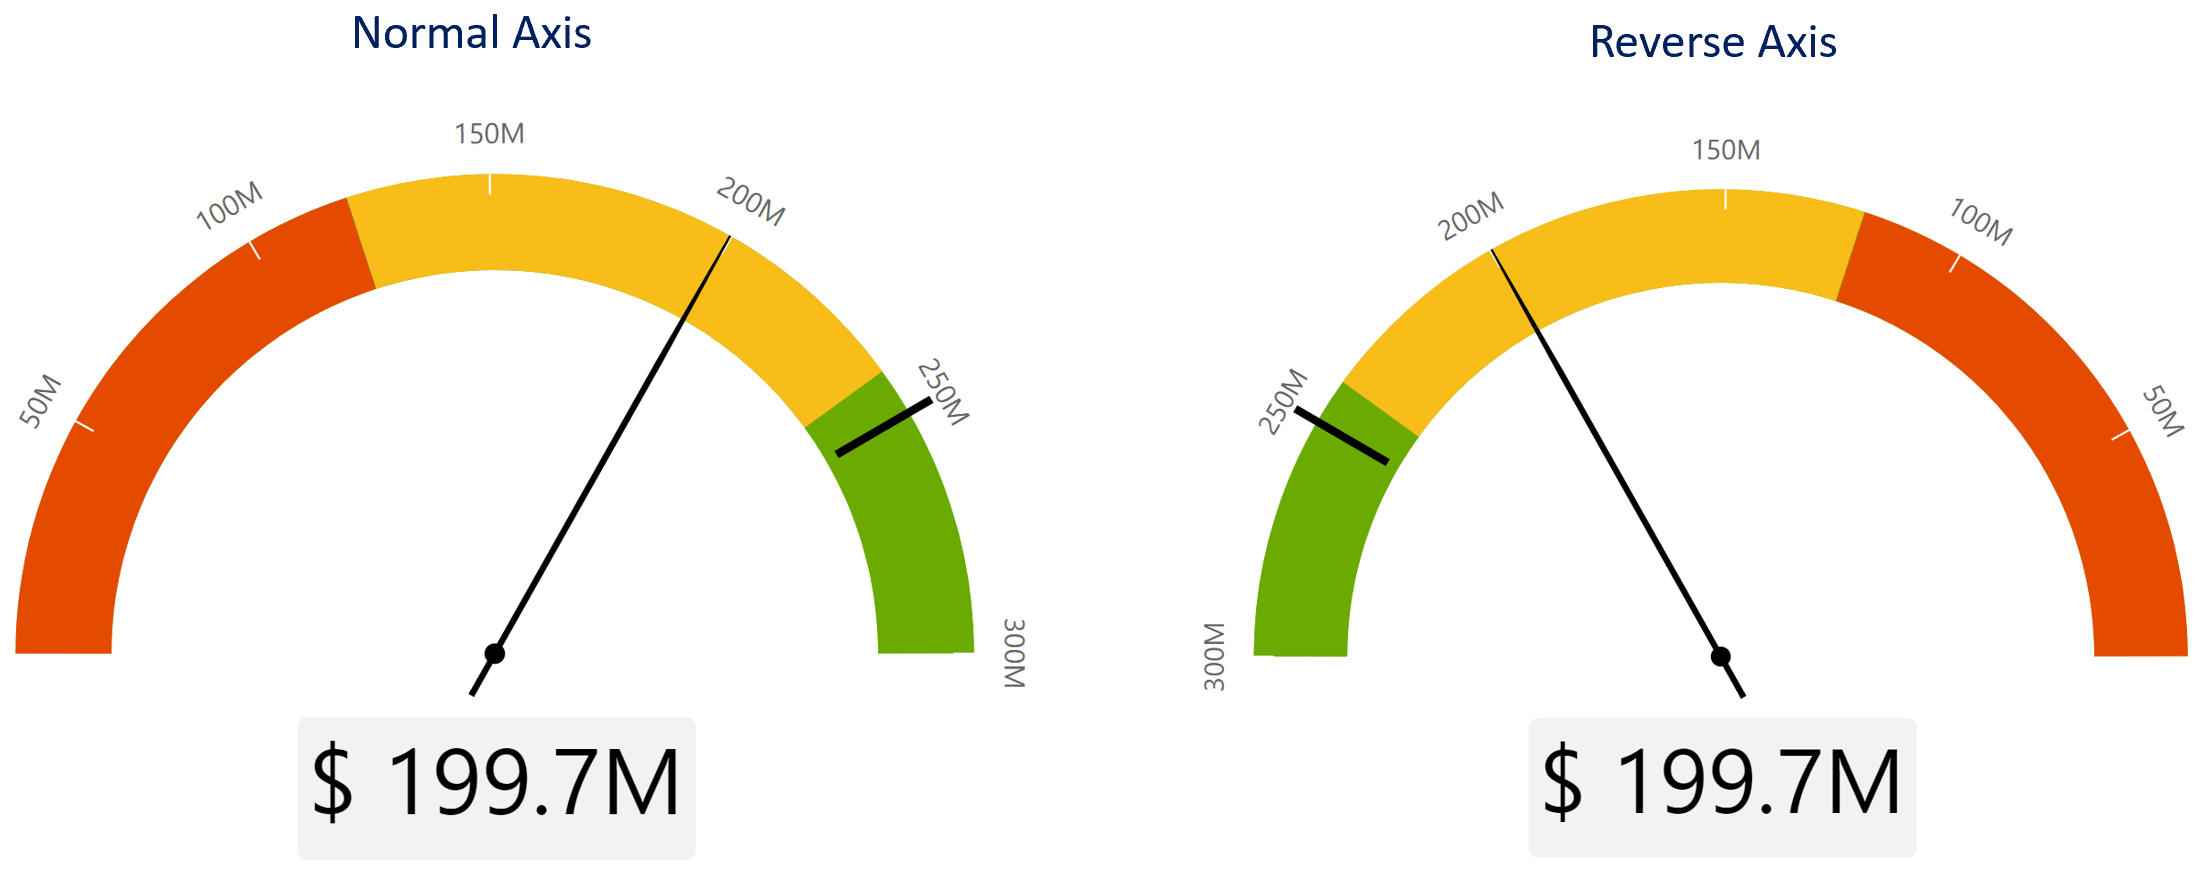
Reverse Axis
In cases, where customers would like to read from left to right especially in the middle eastern countries, we have reverse axis property to reverse the direction of the axis.
We have covered the various customizations of xViz Advanced Gauge, but there is more.
***
To get the latest version of the custom visual, reach out to us here.
You can take a look at the other advanced custom visuals by xViz here.