A combo chart is a combination of two or more charts displayed in a single visualization. It is used to represent data using different types of charts. The purpose of a combo chart is to provide a more comprehensive view of the data and to highlight the relationships between different data sets.
This can help you to identify patterns, trends and relationships that may not be clear from separate charts. A combo chart can make it easier to represent complex data clearly, making it easier for the viewers to understand and interpret the information.
Combo Chart also known as Multiple Axes Chart which are used in various industries, such as finance, medicine, business, data analysis, manufacturing, etc. Traditional charts use only one dimension to represent data, making it difficult to visualize complex data sets. However, multiple axes charts allow you to visualize data in different KPIs, providing a complete picture of the data and enabling you to visualize complex relationships between different variables. This makes multiple axes charts a powerful tool for data analysis and decision-making in a wide range of industries.
xViz Multiple Axes chart allows you to analyse and visualize data and plot data in 12 different type series types like:
1. Column
2. Line
3. Spline
4. Lollipop
5. Area
6. Area Spline
7. Column Stacked
8. Column Percentage Stacked
9. Area Stacked
10. Area Percentage Stacked
11. Area Spline Stacked
12. Area Spline Percentage Stacked
In a multiple axes chart, the option to display data as a combination is available under the "Series Type" option."
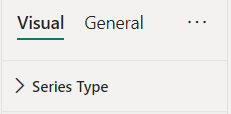
Consider the examples where the use case using series type is explained:
1. Column and Lollipop combo
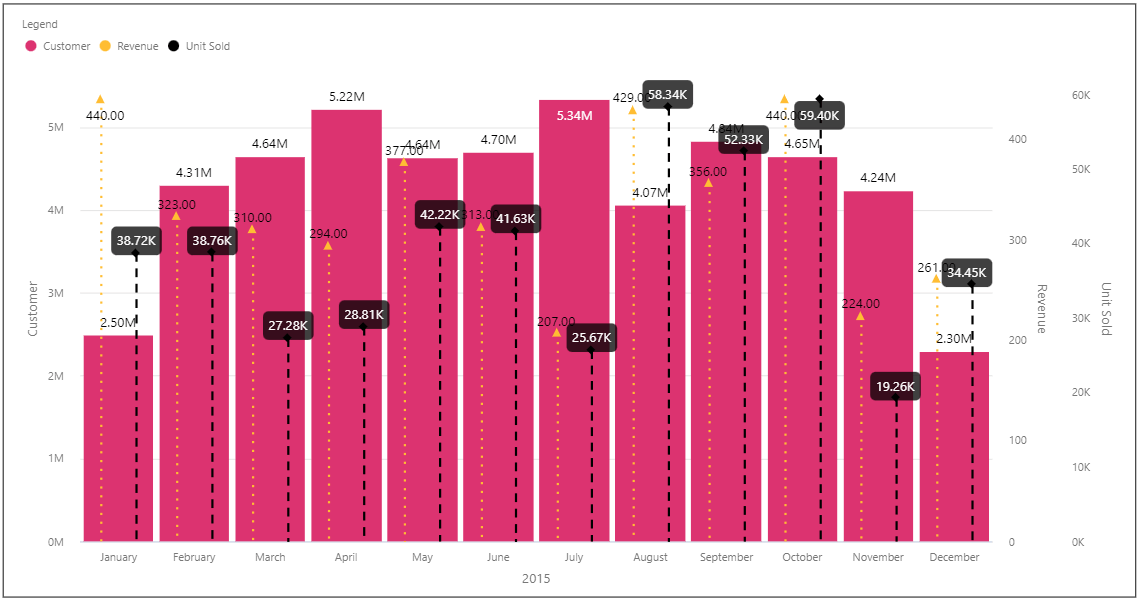
Consider an example where you need to analyze two different metrics Unit Sold and Revenue over a few months based on Customers. This often makes it difficult to compare and visualize the clustering of data. Also, difficult to compare more than 2 axes using the basic Charts.
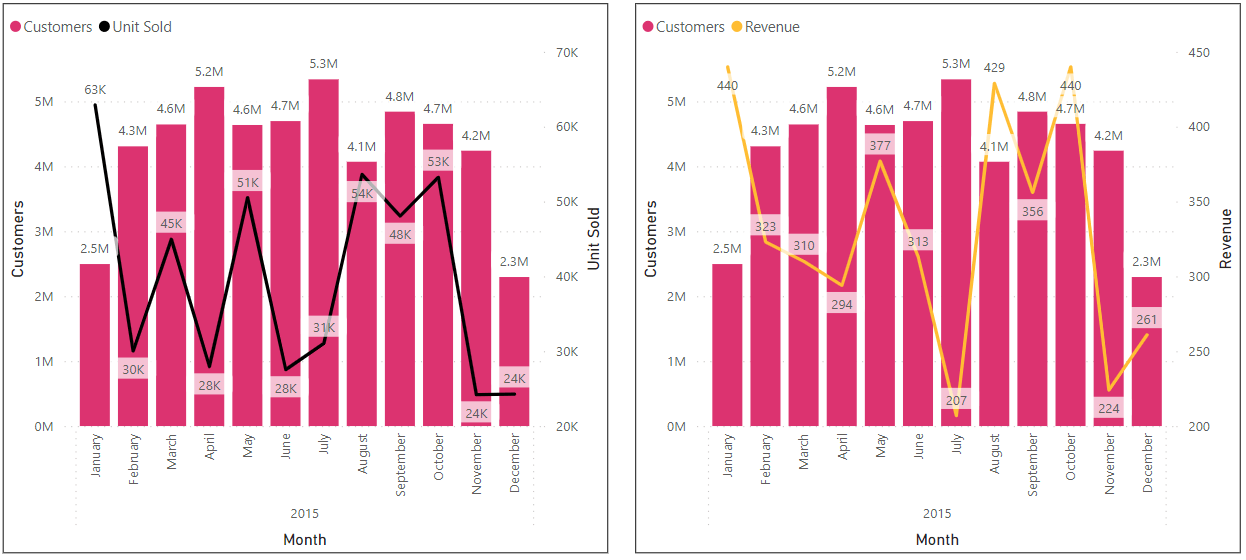
Whereas using multi-axes chart three different metrics can be easily visualized and compared as it supports multiple Y axes (upto 5) for single metrics on X axes. The below example with Customers as a column, Unit Sold as Lollipop and Revenue as Lollipop in a multi-axes chart makes it extremely easy to see month-on-month trends of both metrics in one single visual. The Lollipop (Yellow colour) with an upward arrow represents the monthly increase in the number of Revenue and Lollipop (Black Colour) with the Diamond on the top represents the amount of unit sold by month which is making it easier to analyse the trend.
2. Area and Line Chart combo
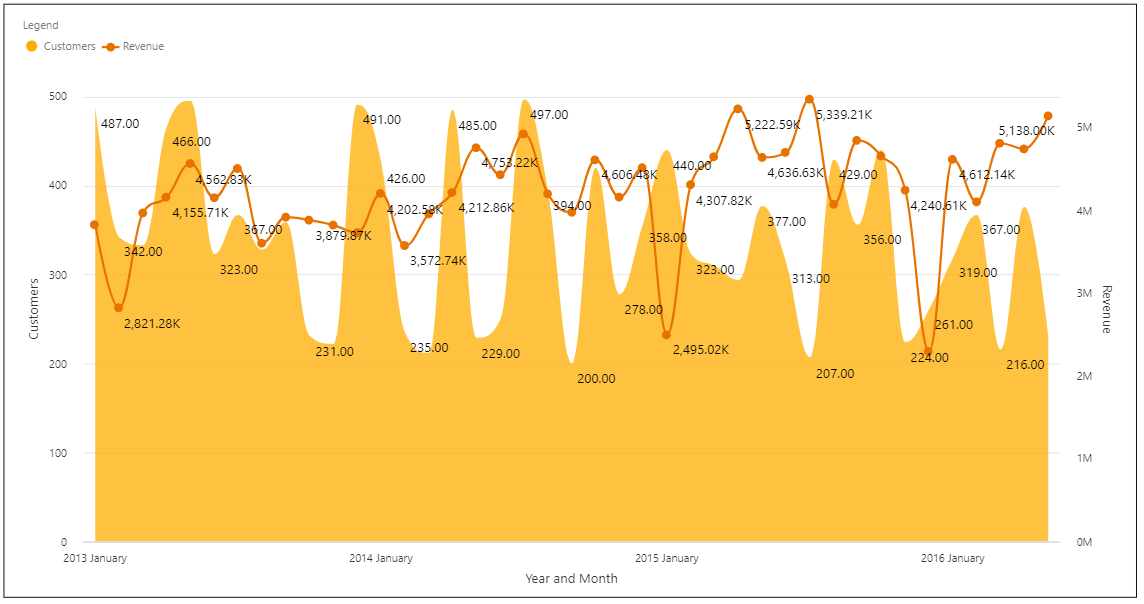
This visualization displays a comparison of Customers, Revenue, and Investment across the months of a year, when the number of categories exceeds 15, column charts can become cluttered and difficult to read in such scenarios area and line charts are recommended.
Whereas the Basic Chart allows you to compare only the Area-wise data or the line-wise data, which is not very easy to analyze the data.
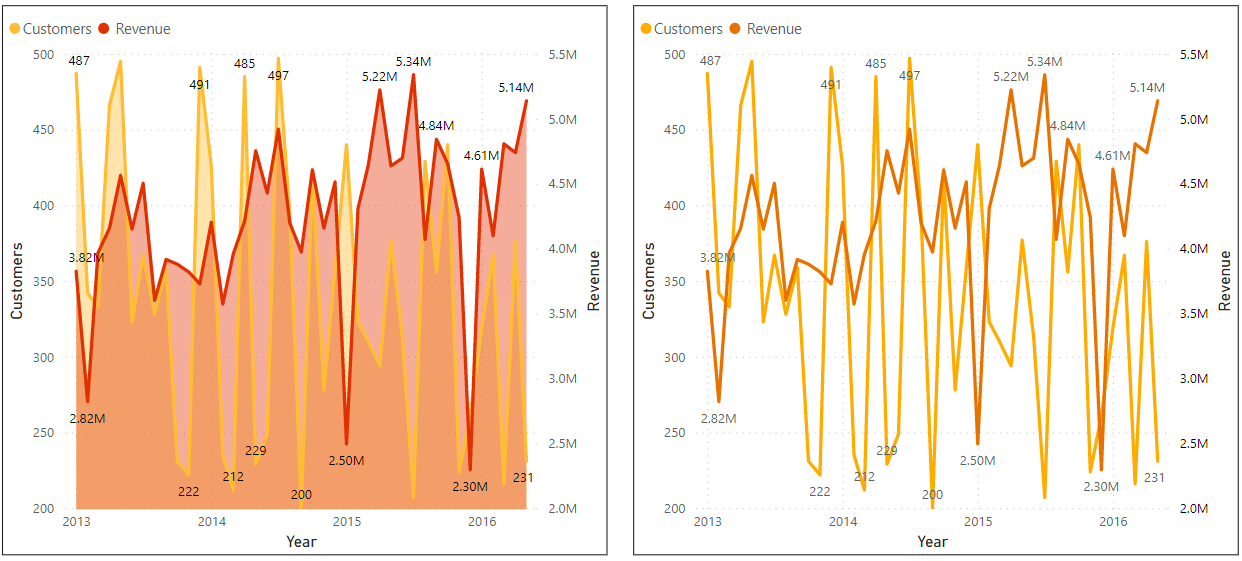
Whereas using the Multiple Axes chart, The Customer metric is displayed as an Area Spline chart on the primary Y-axis (Value axis 1) and the Revenue is shown as a Spline on the Secondary Y-axis (Value axis 3). The area-line representation is advantageous when dealing with categories that have a high number of values.
3. Clustered and Stacked combo
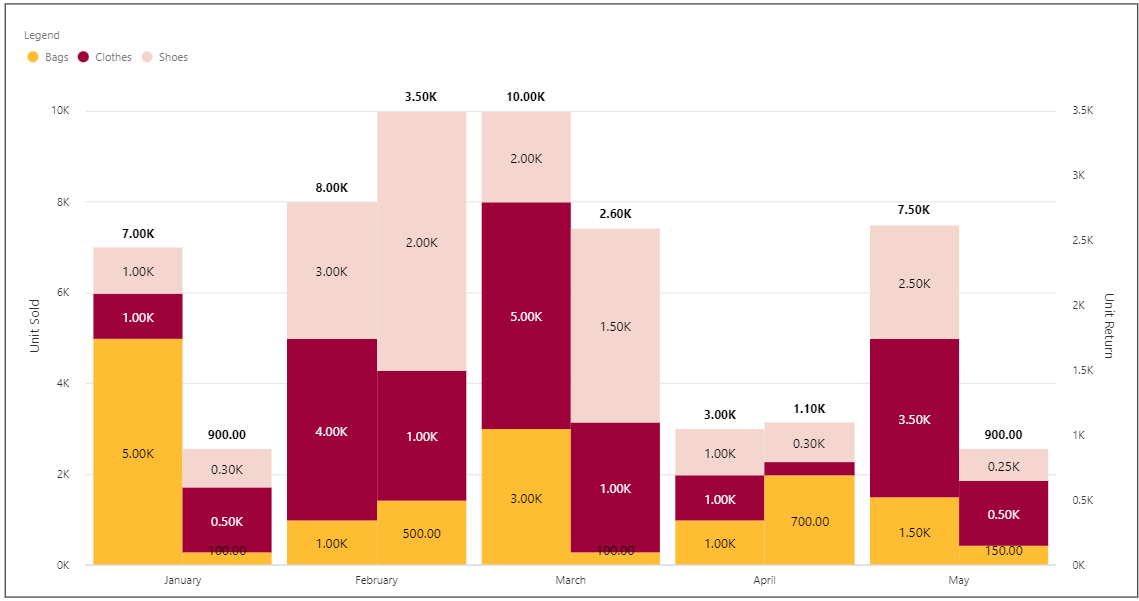
Consider the example where a month-on-month comparison of the sales and returns for three products - Bags, Clothes, and Shoes. With the basic chart, the comparison needs to be analysed using 2 different charts. In the below example, the one chart shows the Unit Sold and another Unit Returns.
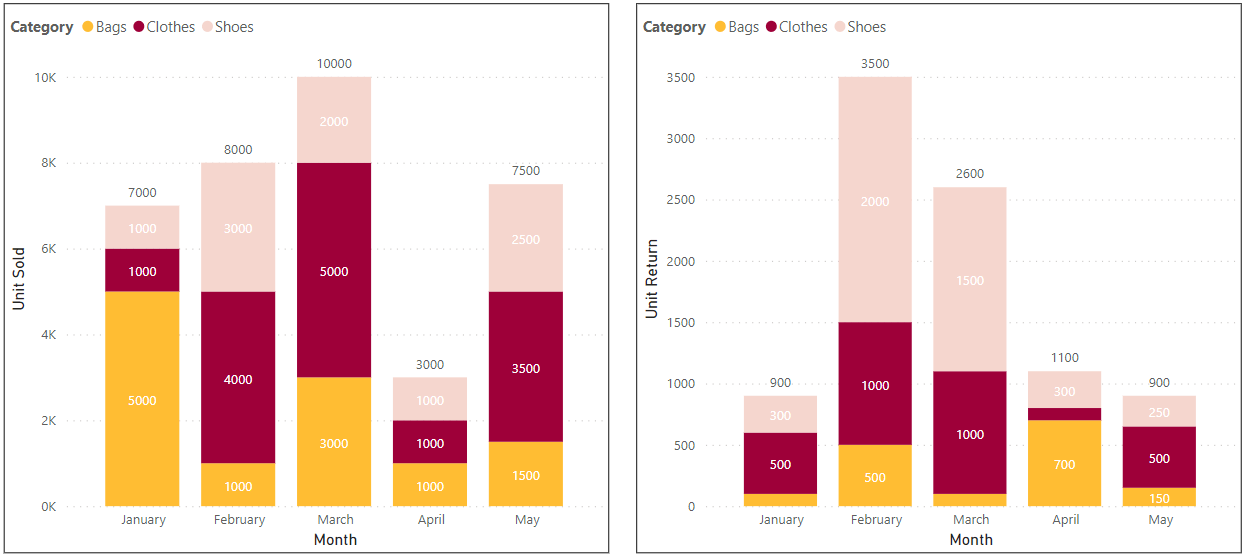
Whereas in Multiple Axes chart it is quite easy to compare the value in one chart.
The number of Units Sold is displayed on the left Y-axis, while the number of Units Returned is shown on the right Y-axis. For each month, there are two columns - the left column represents Units Sold, and the right column represents Units Returned. These columns are then clustered together to provide a comparative view. The three products are stacked together in each column to offer a comprehensive view of Units Sold and Units Returned for each product. This type of representation is made possible by the Cluster and Stacked feature of a multi-axes chart.
4. Column and Multiple lines on different scales
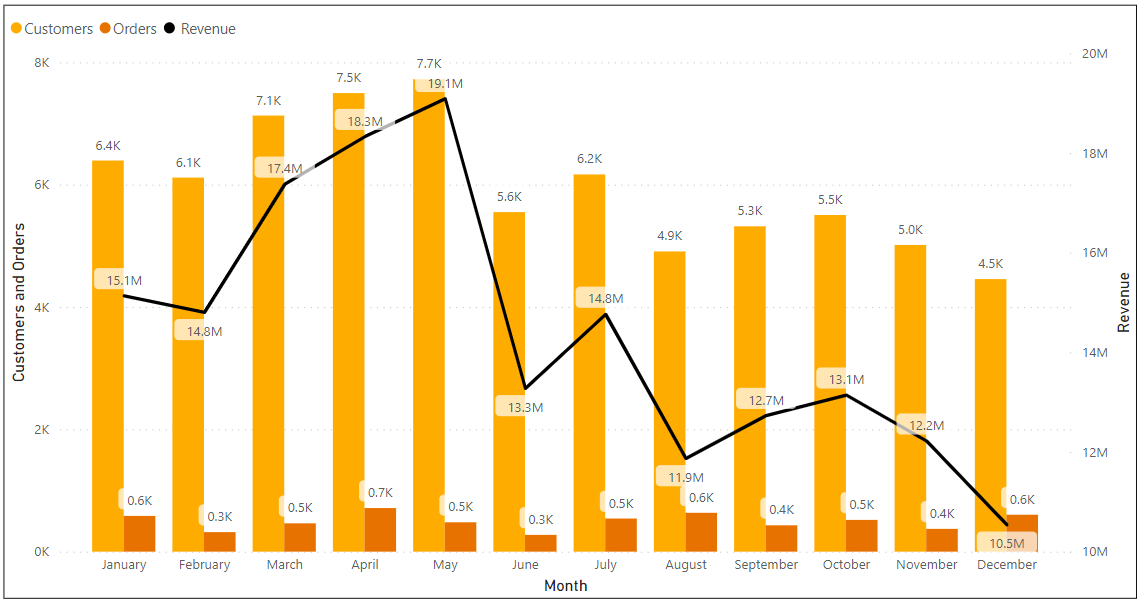
Consider an example where the visualization displays a month-on-month comparison of Orders received and Total Revenue generated based on the number of customers. Customers are in Thousands, Orders in Hundreds, and the Total revenue in Millions. In the basic chart, the common scale is used for values which makes it difficult to analyze the numbers and result in flat appearance.
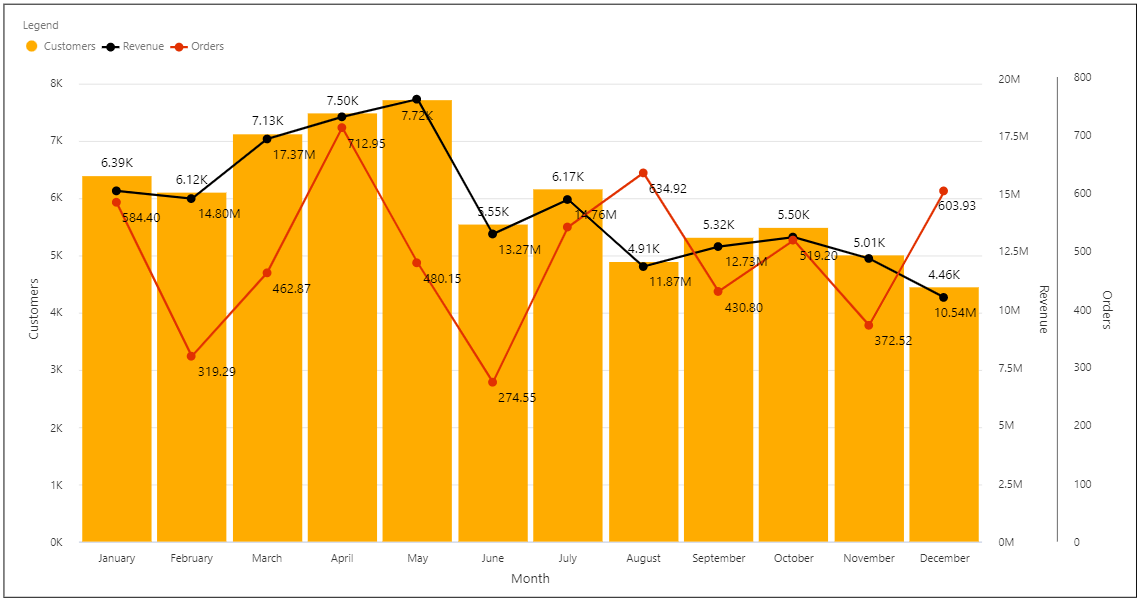
In the Multiple axes chart, the Customer’s metric is represented as a Column as the primary Y-axis (Value axis 1), while the Total Revenue and Order metrics are shown as Line as secondary Y-axes (Value axes 2 and 3, respectively), where the Total Revenue is in Millions, while Orders is in hundreds and Customers in Thousands. Therefore, in such cases, each metric should be given a different scale. The chart provides five different scales to add data, and any scale can be used to represent the data.
5. 100% Stacked Area
Area charts are an effective way to visualize dense data over time. One useful variation of the area chart is the 100% stacking, which provides a part-to-whole representation of the data, highlighting the contribution of various categories over time on the horizontal axis. Additionally, the visual can also incorporate a spline variation using the Area Percentage Stacked option, giving the area visualization a curvy style.
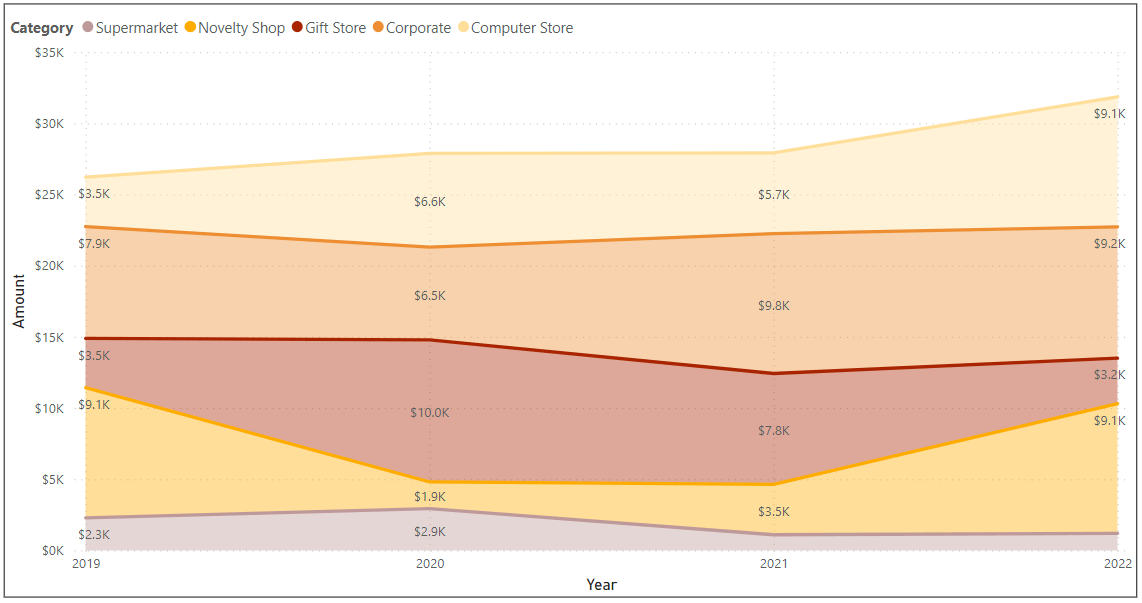
The basic Chart support Area stacked chart where it does not support the 100% stacking on area.
100% stacking makes easy to analyse the quantity of % data is divided.
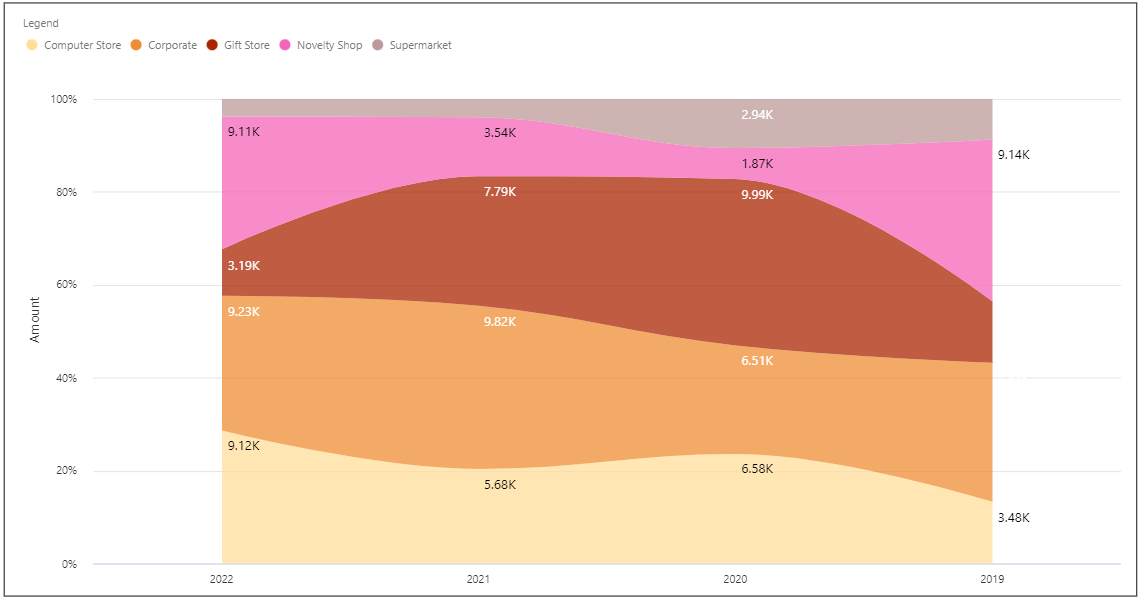
In the Multiple Axes chart, the axis on the chart represents a year-wise comparison of different categories, including Computer Stores, Corporate, Gift Stores, Novelty Shop, and Super Market. These categories are represented as an Area 100% stacked chart, providing a visual representation of the proportion of each category's contribution over time
The multiple axes chart, also known as a combo chart, offers 20+ different combinations using the different configurations. Check out this blog for a detail understanding of the different use of combinations.
Try out the xViz Multiple Axes Chart visual from Microsoft AppSource.