Note: This blog addresses some features of the custom visual that will be available in the App Source in Nov 2019. To get this latest build, reach out to us here.
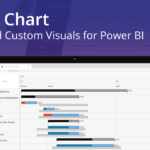
The Hierarchical Tree is an advanced custom visual of the xViz suite built for Power BI to showcase hierarchies in a more visually appealing manner. Visualizing Hierarchy can be tricky when it comes to data.
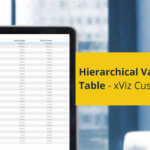
Usually a visual in the form of a table(like the Hierarchical Variance table) or at times in the form of a selector (like the Hierarchical Filter) can be used to understand data that comes in the form of hierarchies. It comes handy with a lot of features and the flexibility to customize it in such a way that it suits a lot of business requirements where we deal with Hierarchies.
Key Features – Summary
- Visualize large enterprise hierarchies with ease
- Displays contribution of each node
- In-built absolute & % variance calculation
- Different modes of Display for the Progress Bar
- Show alerts on Progress Bar
- Conditional Formatting capabilities on nodes and values
- Minimap feature for easy navigation
- Effective Find & Seek option to search any Node in the hierarchy
- Expand on-demand to decompose each category.
- Runtime Configuration capabilities
Key Features – Description
- Visualize large enterprise hierarchies with ease The visual can be used to visualize hierarchies of different sizes ranging from small & medium businesses until large enterprises.
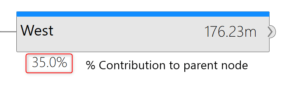
2. Displays contribution of each node
The hierarchical tree displays the contribution of each node to its parent node in a percentage format.
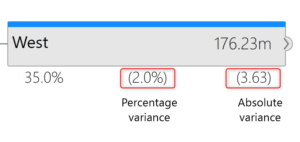
3. In-built absolute & % variance calculation
In addition to the contribution of each node, the advanced decomposition tree comes with the ability to compare two series values (actual & budget, actual & forecast, current year vs previous Year values, etc.) and display the absolute variance and % variance of each node.
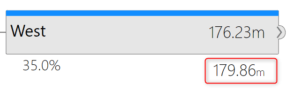
The user can also disable the Series Comparison option in Tree Options and choose to display the value of the second series as shown below.
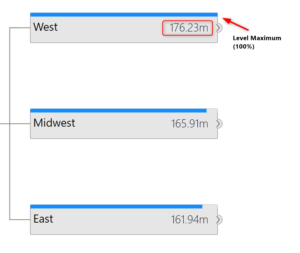
4. Different modes of Display for the Progress Bar
Each node of the visual comes with a Progress bar which can be configured in 4 different ways.By default, the progress bar displays the ratio between each node and the maximum member in each level.
The other options to configure the progress bar are:
Contribution to parent – the ratio of each node compared with the parent value as 100%
Contribution to the top node – the ratio of each node compared with the top node as 100%
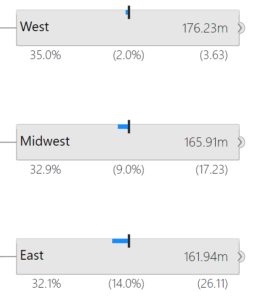
% Variance – percentage variance when 2 measure fields are added.
The progress bar displaying negative values of variance will be travel reverse direction as shown below.
5. Show alerts on Progress Bar
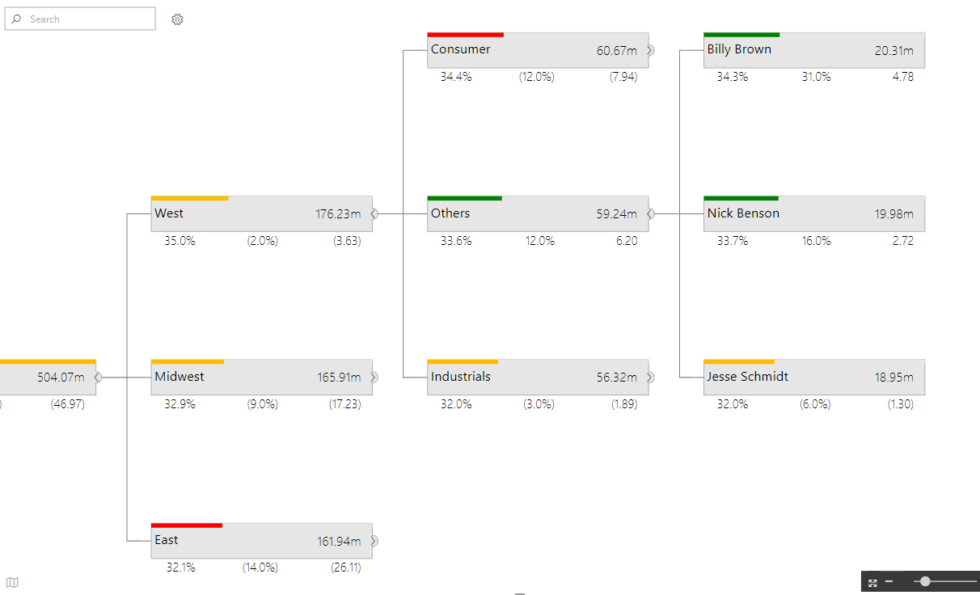
Turn on the Conditional formatting section within the Format tab to configure and display alerts on the progress bar based on the % variance values.
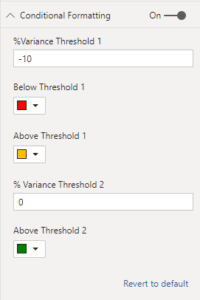
Based on the threshold values, the tree will be displayed with alerting colors on the progress bar.
6. Conditional Formatting capabilities on Nodes and Values
In addition to the alerts on the progress bar, the user can also do conditional formatting for the node and the values within the node. This can be done within the Advanced editor of the visual accessible with the pencil icon.
Large enterprise hierarchies go up to 15-20 levels and it becomes tough for the users to navigate within the tree. To facilitate easy navigation, the hierarchical tree comes along with a minimap feature which helps you navigate to any part of the hierarchy seamlessly.
8. Effective Find & Seek option to search any Node in the hierarchy
In most cases, we would like to navigate to a specific node in the hierarchy without going level by level. In such cases, you can just search for that particular member in the hierarchy and the find & seek option will take you to that node.
9. Expand on-demand to decompose each category
Each category of the hierarchy can be decomposed into its member nodes in an ad-hoc manner. This can be really helpful when you want to randomly pick categories from the hierarchies without any specific order. For example, you would want to see how a particular product is performing in the West region without getting into the store level details.
10. Runtime Configuration capabilities
The runtime configuration menu comes handy with the four options namely
Re-arrange by – Lets you rearrange the hierarchy by choosing the immediate category in a user-specified order
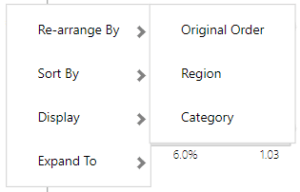
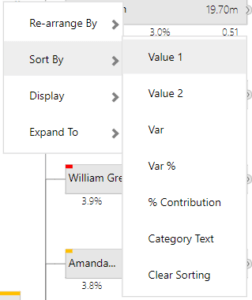
Sort By – Custom sort option based on Absolute Variance, % Variance, contribution, etc., which cannot be done using the default Power BI Sort.
Display – Allows you to show/hide the Absolute Variance, % Variance and Contribution values.
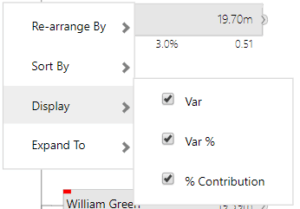
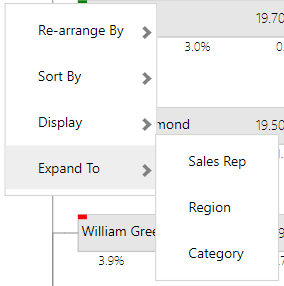
Expand To – expands to the user-specified level in the hierarchy.
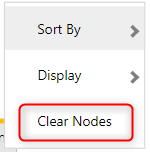
In the Expand on-demand mode, an additional option to clear the categorical node selection for decomposition will show up.
To get the latest version of the custom visual, reach out to us here.
You can take a look at the other advanced custom visuals by xViz here.