This blog is part of the Multi Axes Blog Series
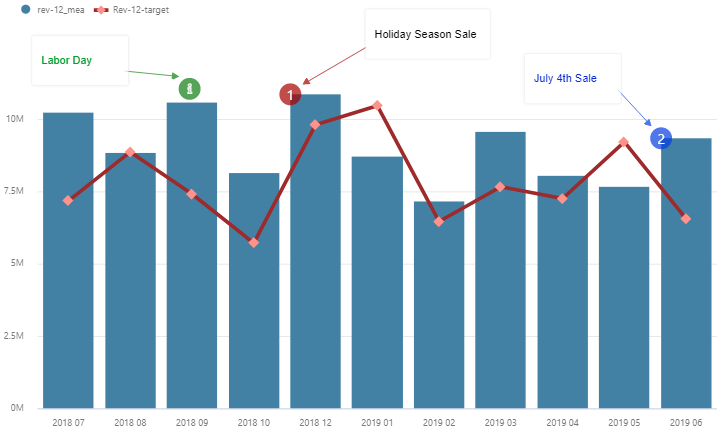
Annotations provide context to enhance your storytelling experience with textual call outs and drive attention to important areas. Annotations help communicate one’s ideas effectively by drawing attention to the marked areas with different colored icons and arrows.
Use Cases
- Storytelling – Answer immediate questions as to what caused the dip or spike in sales
- Outlier detection – Highlight Areas or specific data points which need attention
- Printed reports – Cases where you need print reports, Annotations can guide users on how to interpret your visualization with questions or additional information
Types of annotations
- Datapoint Annotation
These are annotations made on data points where users can reference or include the data points(categories + values) as part of their annotation.
Note- The annotation will disappear if the data point is filtered out.
2. Canvas Annotation
These annotations are made on non-data elements of the chart i.e the chart background or plot area. The only difference from data point annotations is that you cannot reference any data values in these types of annotations. They are indicated with a different icon.

Different Display options for Annotation
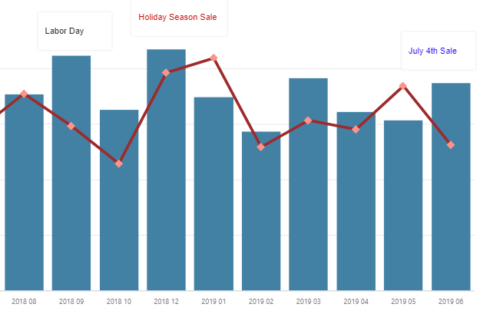
- Text Only – Great way to annotate or comment specific areas of the chart
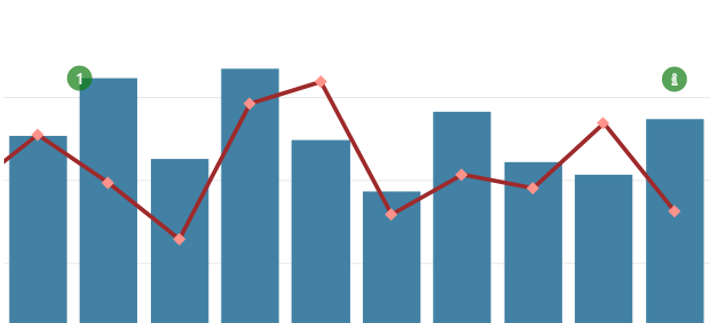
2. Icon Only – Display annotation as icon only with text display on hover
3. Text+ Arrow – Pinpoint areas or data points which need attention with help of arrows
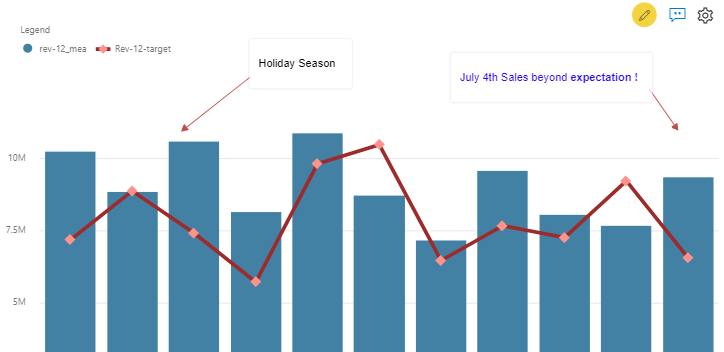
4. All – Display text, icon, and arrow
Annotation in Summary Table
Datapoint Annotations, since they are mapped to a data point, are also displayed in Summary Tables.
***
The xViz Multi Axes Chart is a part of the xViz Pro Suite, check out all the resources for Multi Axes Chart including other blogs, and FREE Power BI Desktop Version!
Check out all the Power BI Visuals in the xViz Pro Suite here.