Note: This blog addresses some features of the custom visual that will be available in the App Source in Nov 2019. To get this latest build, reach out to us here.
This blog is part of the Bullet Chart Blog Series
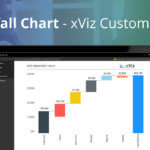
Bullet charts are a variation of a bar chart developed by Stephen Few as a replacement for gauges and meters. The Bullet chart has the following advantages over the gauges.
- Space saver – require less real estate, can be oriented horizontally and vertically based on the space available.
- Display multiple measures
- Easier to read and more informative
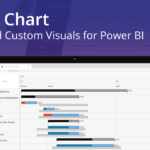
Now lets us look at some of the key features of the xViz Bullet Chart for Power BI
Key Features – Summary
- Comparison of Band customization
- Marker for 2 Benchmark Values
- Marker customization
- Conditional Formatting
- Analytics
- Reverse Axis and Legends RTL support
- Orientation
- Summary Table
- Detailed Tooltip
Key Features – Description
- Comparison Band
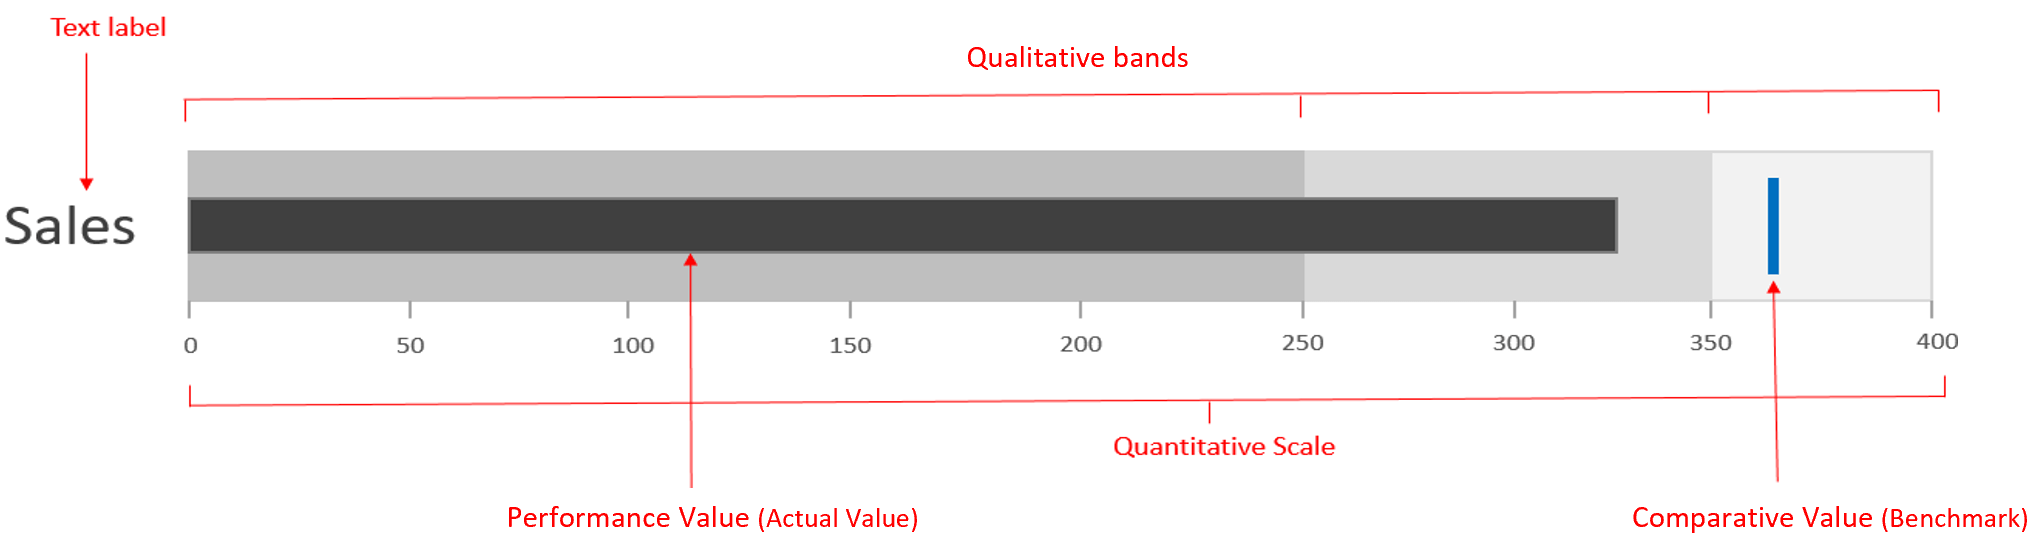
The comparison band can be used both as a comparative series as well as the qualitative range.
Comparative series – Apart from the benchmark values, the xViz Bullet chart provides the ability to have another series option to compare with the actual value. This could be useful in a couple of use cases – for example, if you would like to compare the Actual Sales of a product with the budget and previous year value. In this case, the previous year could be used as a comparative series.
Qualitative ranges – The qualitative ranges act as a performance indicator where each color represents a different state for e.g. good, bad average as seen below. It indicates how good or bad the value is depending on which band it resides. xViz provides the ability to both rename and define the percentage range for each of the bands.

Click here for more details on how to configure the comparison band.
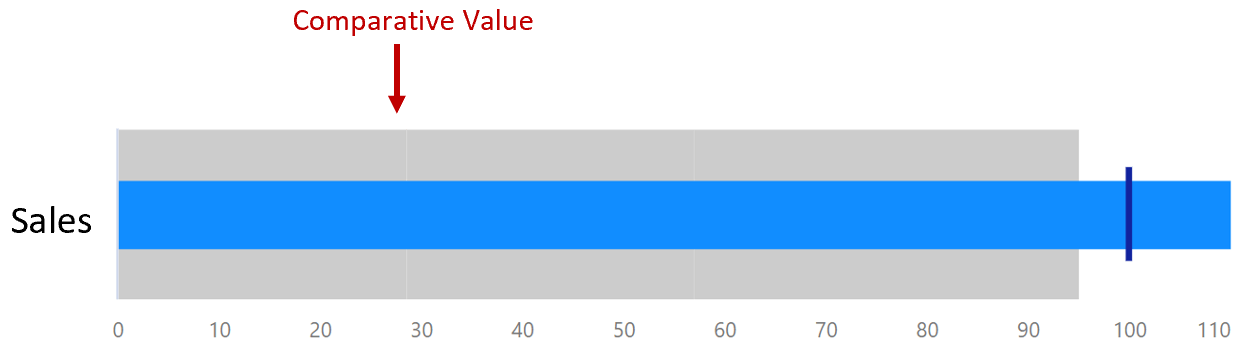
2. Marker for 2 Benchmark Values
In certain scenarios, if customers would like to display more than one benchmark value e.g. comparing Actual product sales with forecast and plan value together then they could now do as xViz provides the ability to have 2 values.

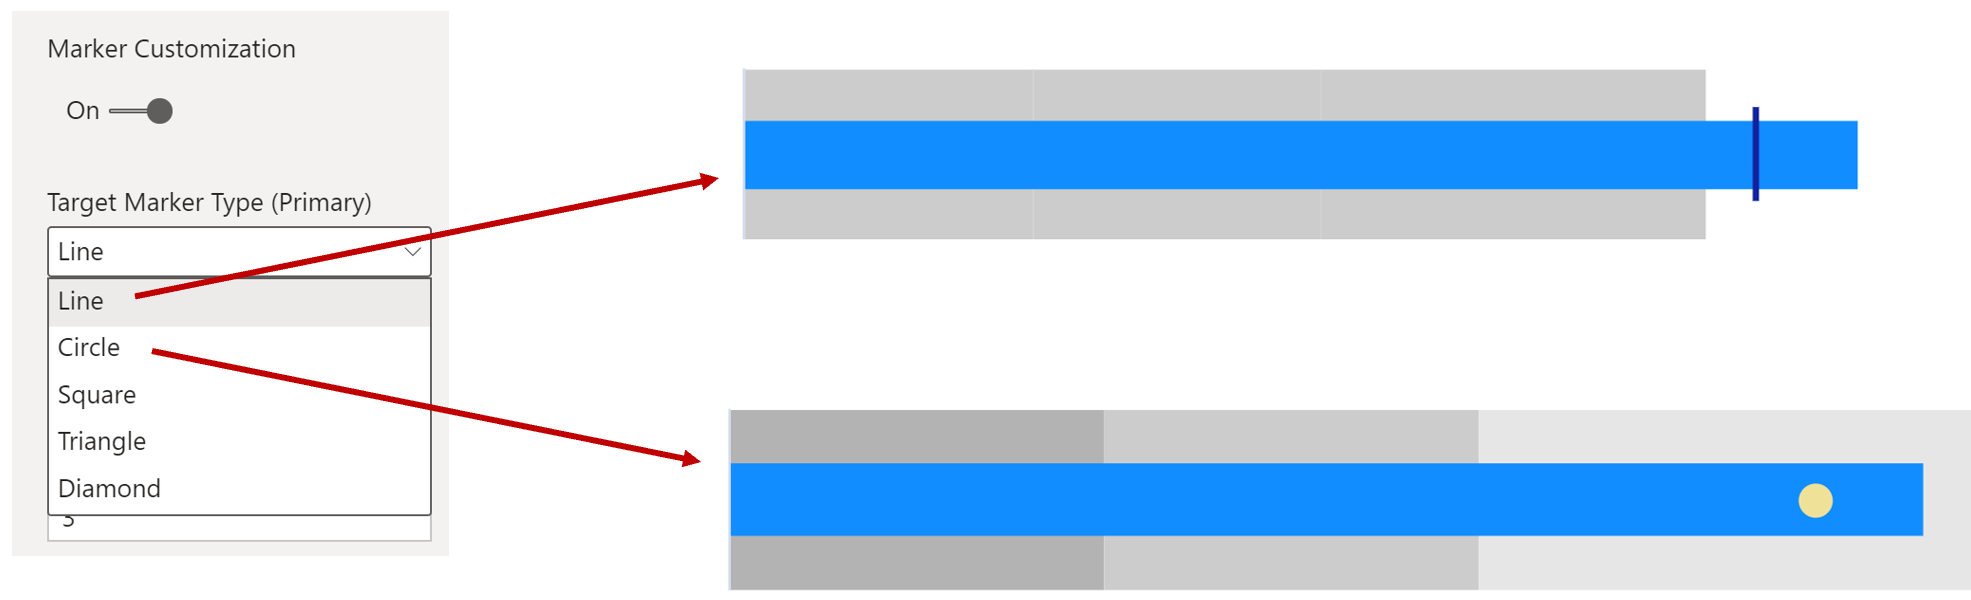
3. Marker Customization
To make it more visually appealing, various customization options are provided for styling the marker for the benchmark value. You can choose from different marker shapes, sizes and color
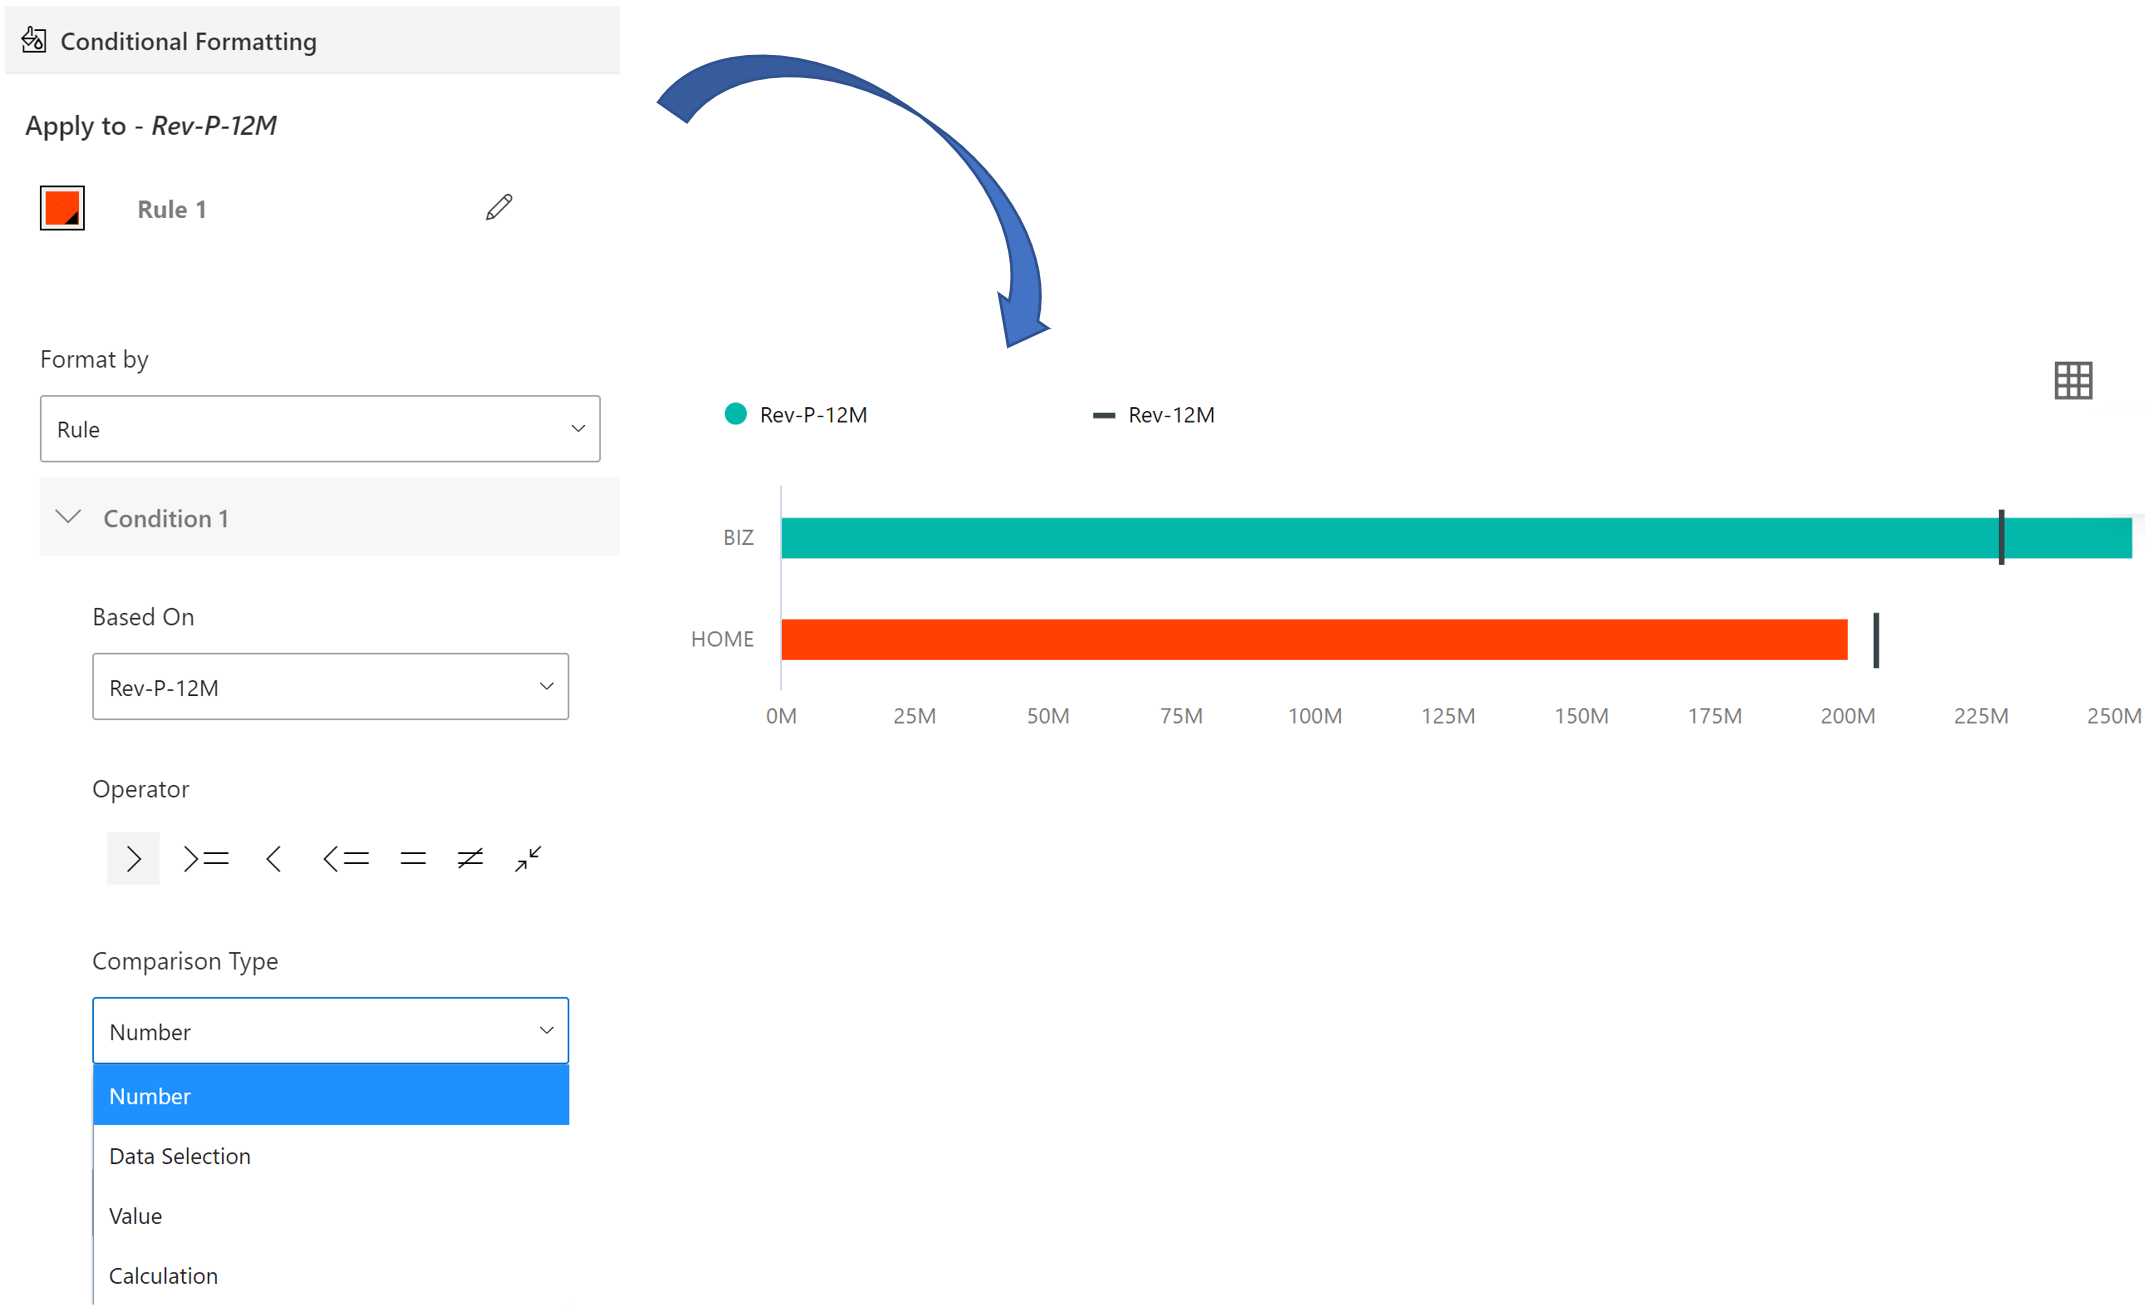
4. Conditional Formatting
xViz Bullet chart provides robust alerting capabilities. The conditional formatting is available as part of our advanced editor which be a small pencil sign.![]()
You could set several different rules based on Values (data assigned to the chart), number, Category value, data selection (particular data cell from the data source) or calculation.
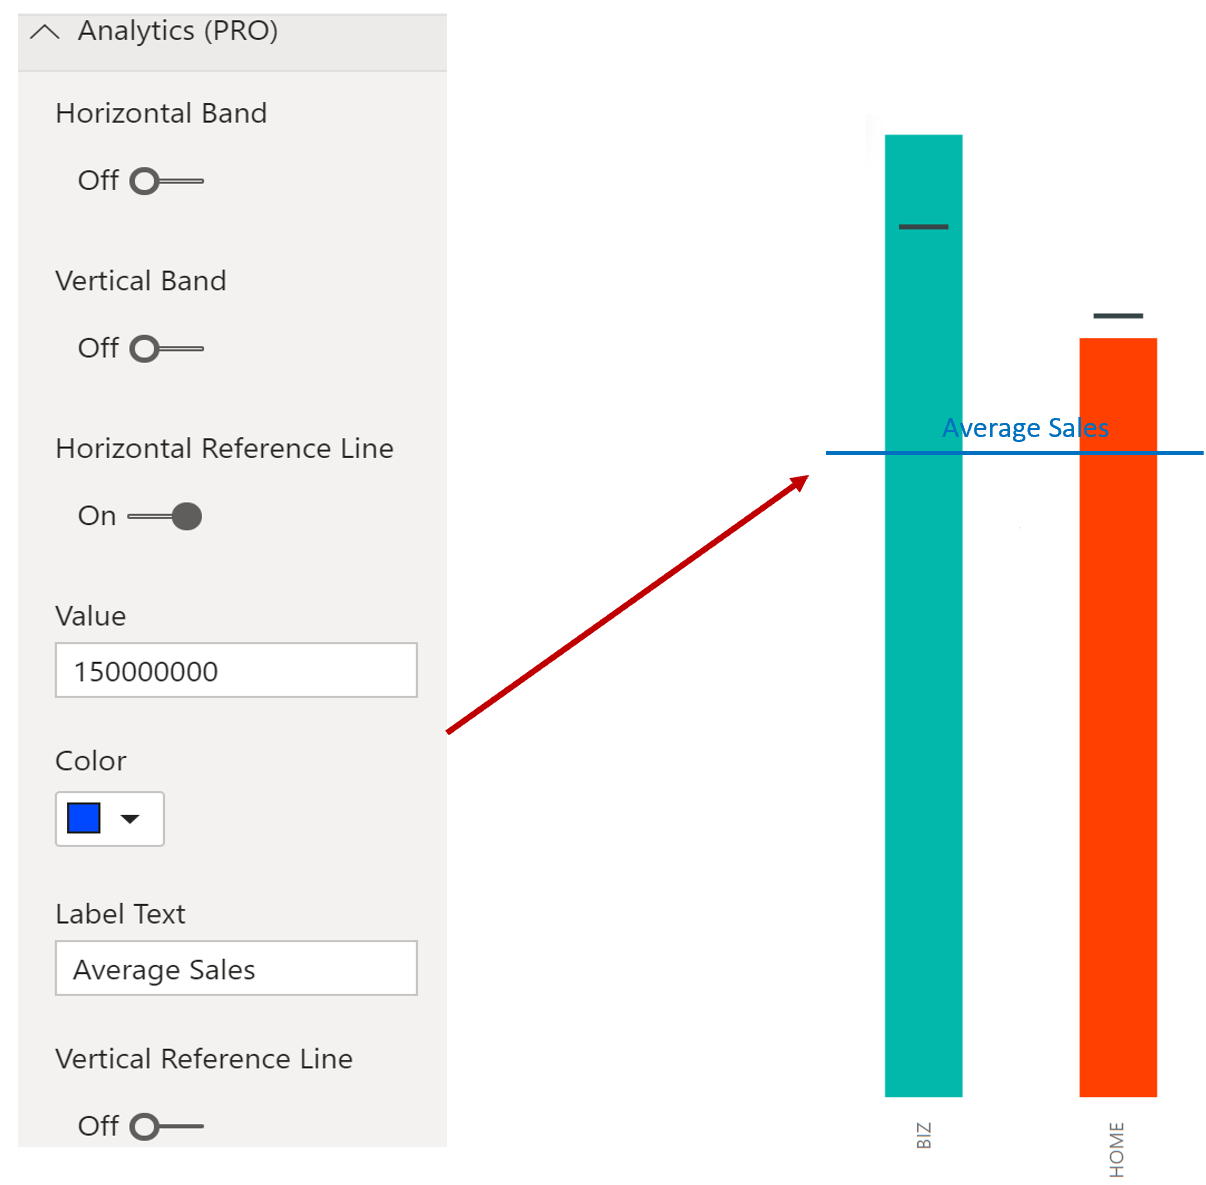
5. Analytics
Apart from setting benchmark value for each bullet category, you could also set a common benchmark using the horizontal or vertical reference line under the analytics section. For e.g. to display average sales value while comparing actual vs target sales for each of the products. Similarly, the horizontal or vertical band could also be displayed to support your business use case.
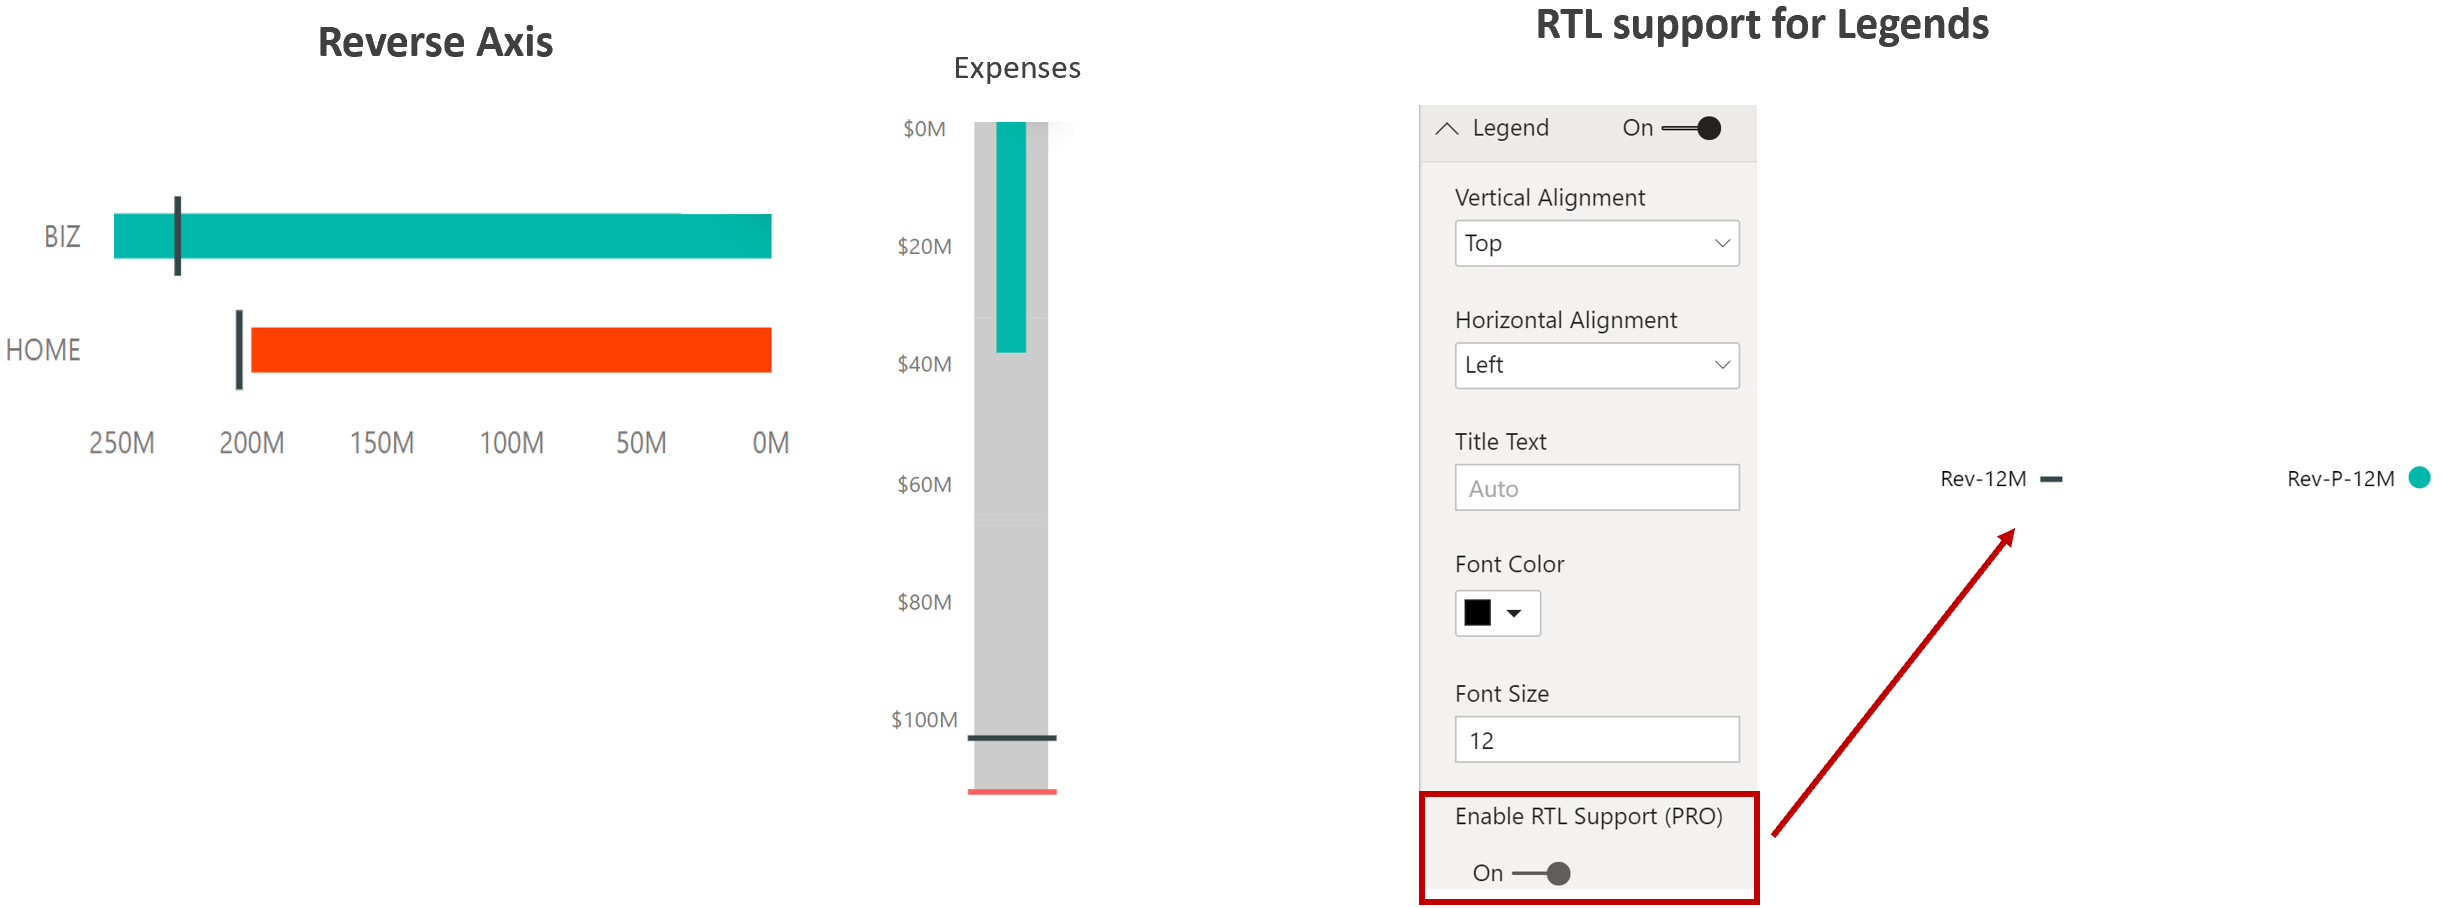
6. Reverse Axis and Legends
Reverse Axis is available for both X and Y-axis. For X-axis it helps reverse the order of the axis labels and for Y-axis it helps change the direction of the axis. Along with this xViz also provides RTL support for legends which is especially helpful for cases where the customer would like to read from left to right like in the Middle East.
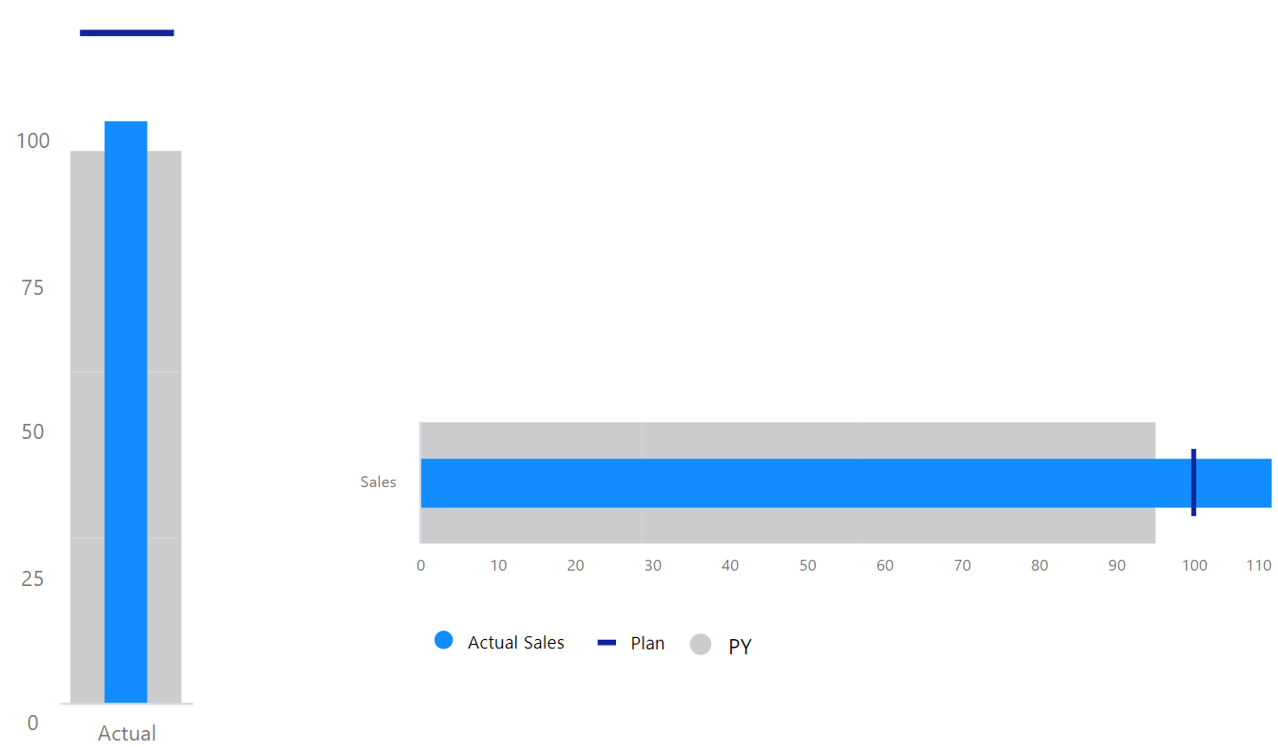
7. Orientation
The xViz Bullet chart provides the ability to change the orientation as desired. You can choose between horizontal and vertical chart orientation with vertical orientation more suited for trend and horizontal more suited for KPIs.
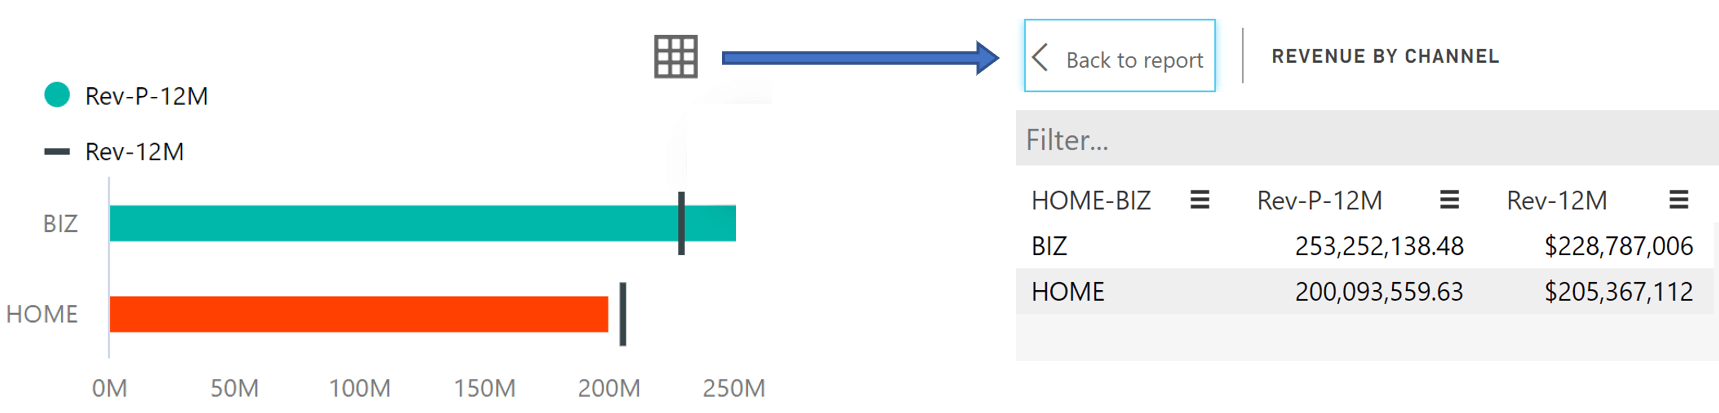
8. Summary Table
Quite often customers like toggling or looking at the chart data in a tabular format. Instead of doing some complex workarounds to achieving this, xViz natively provides a Summary Table option. This is defaulted to be visible with the ability to turn it off from the Chart options property tab.
9. Detailed tooltip
Based on the values configured for the bullet chart, the tooltip provides a consolidated view to display all the data at once using the Shared Tooltip property found under the General tab. Apart from this, if the user would like to display more information as a part of the tooltip then they could do so by simply adding the required fields to the tooltip filed under the fields pane. Further, there is also a separate property to enable/ disable the comparison band tooltip.

We have covered the key features of xViz Bullet Chart so far but there is more.
***
To get the latest version of the custom visual, reach out to us here.
You can take a look at the other advanced custom visuals by xViz here.