Note: This visual will be available in the App Source only in the first week of September 2019. To get the latest build, reach out to us here.
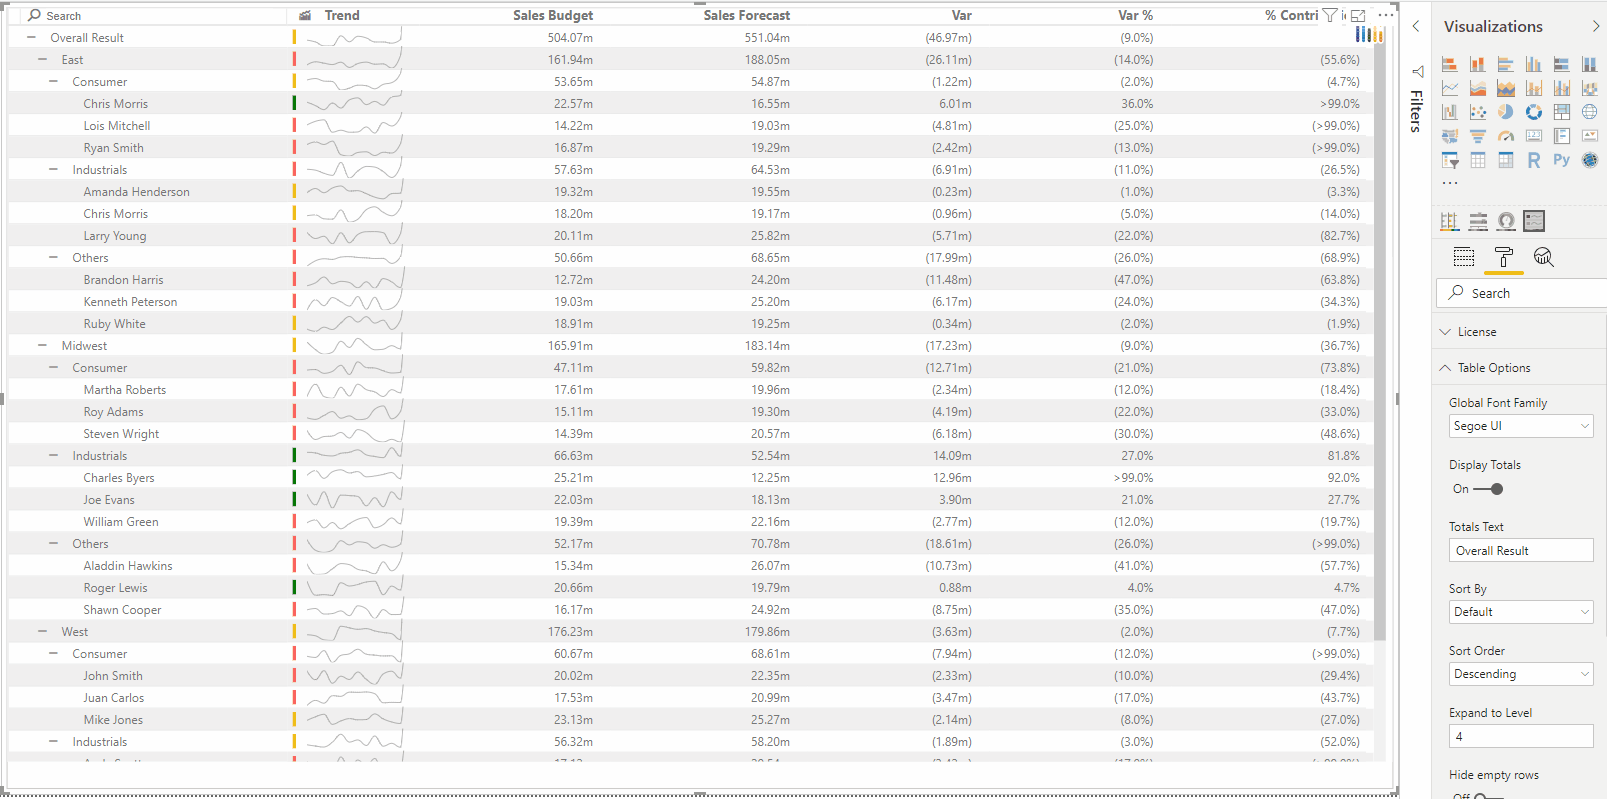
The xViz Hierarchical Variance table provides the ability to the user to view and analyze hierarchical data with much more detailing added to it. The extensive list of features lets you to consume business trends, hierarchies and different forms of data all at once and view it in a much appealing visual form.
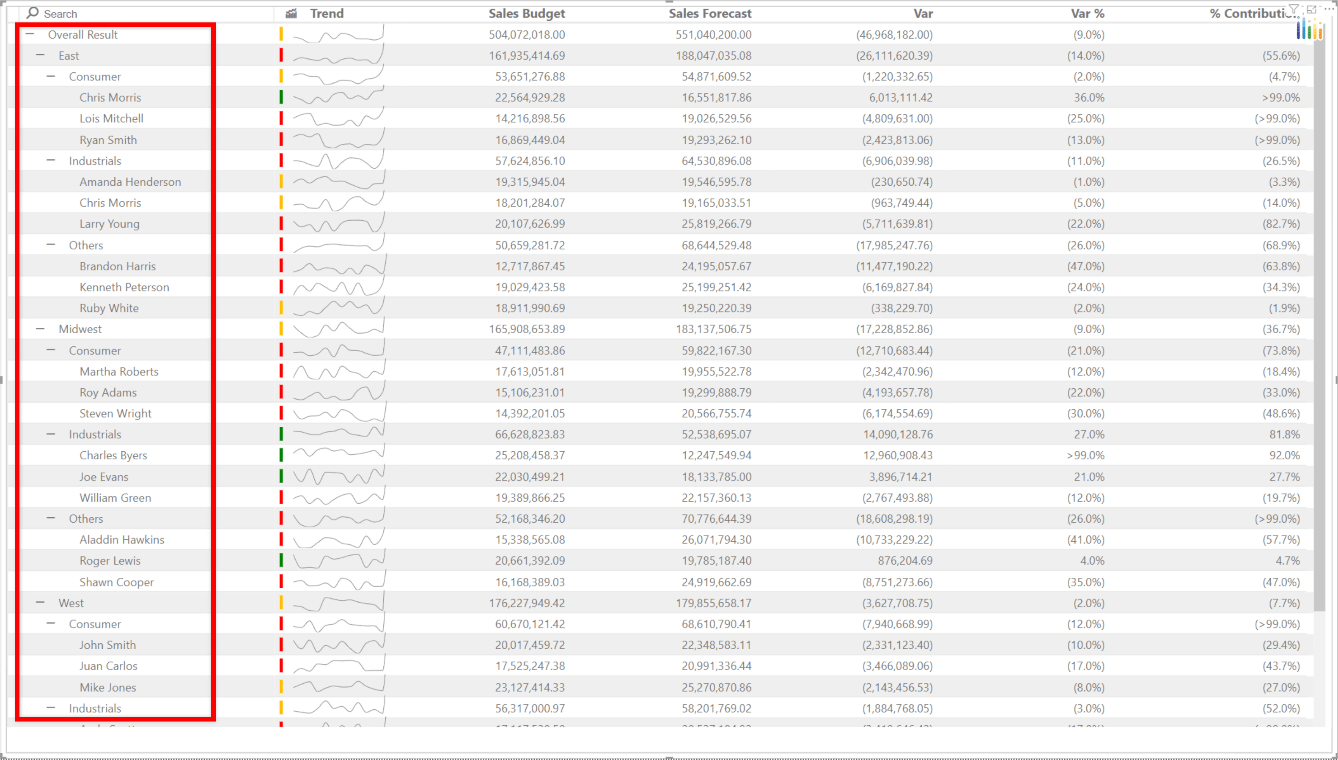
I will be using a Sales Performance Dataset to showcase the key features of xViz Hierarchical Variance table. The dataset has two measures viz., Sales Budget and Sales Forecast values for a period of 12 months. The categorical hierarchy has Region, Category & Sales Representatives.
Key Features – Summary
- Expand/Collapse-enabled hierarchical table
- Track absolute & percentage variance for each level in the hierarchy
- Track percentage contribution by level
- Display sparkline chart to show performance across time periods
- Show/hide overall total
- Search across hierarchy levels
- Semantic formatting
- Conditional formatting
Key Features – Description
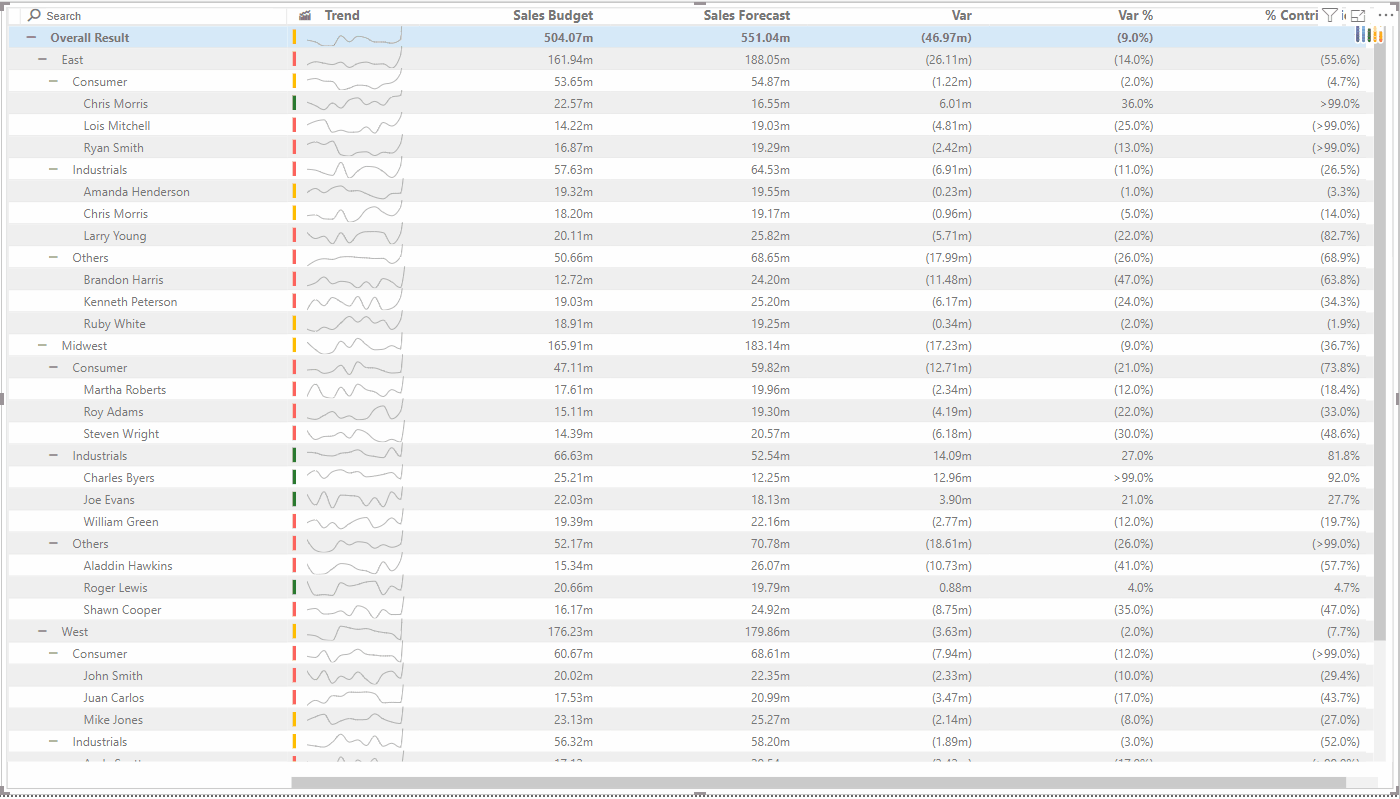
- Expand/Collapse-enabled Hierarchical Table
Without the need to drilldown, you can view all the levels of data at once on the Hierarchical Variance table. As and when you add more categorical fields into the report, it gets added as an additional level on the hierarchy.
2. Track Absolute & Percentage Variance for each level in the Hierarchy
As I have added two measures – Sales Budget & Sales Forecast, the xViz variance table calculates the Absolute Variance, % Variance at every level of the hierarchy irrespective of the level at which the data is added.
3. Track Percentage Contribution by level
The contribution % of each member to its parent is also another important detail that is shown to the users by default in the hierarchical variance table.
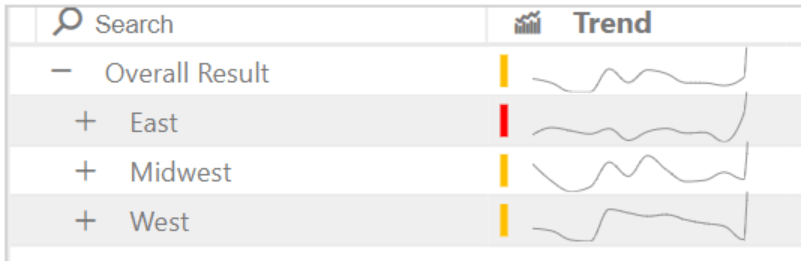
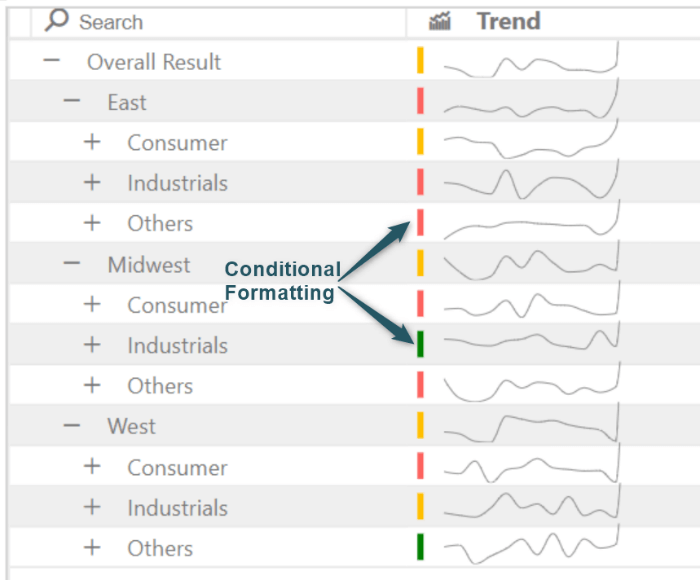
4. Display Sparkline Chart to show Performance across Time periods
Any Period field can be added to the category to add it into the hierarchy. But, when the period field is added into the Time Period, a sparkline appears beside every member to display the trend of the data.
5. Show/Hide Overall Total
The Overall Total can be shown/ hidden by toggling the Display Totals option under Table Options.
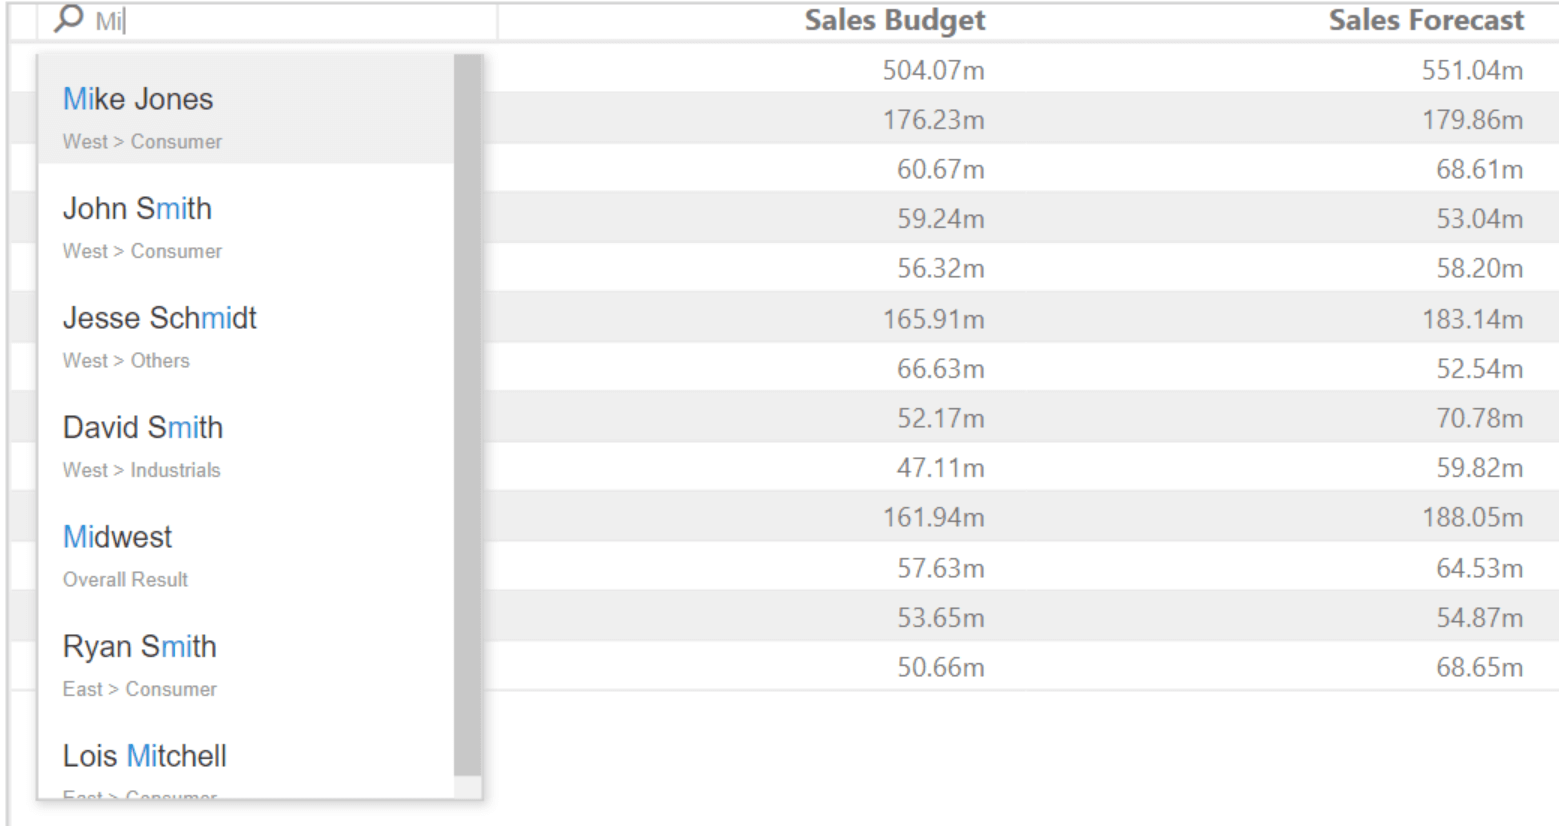
6. Search & Filter across hierarchy levels
Hierarchy Variance Filter comes with an advanced search option which lets you to search and filter by just typing in the text.
7. Find & Seek for members at any level
For this, you will need to switch the search option to Find & Seek. This is very different from the Filter option as it just takes you to the specific member that you’re searching for.
8. Semantic formatting
This feature can be used to visually differentiate positive and negative values based on your enterprise needs.
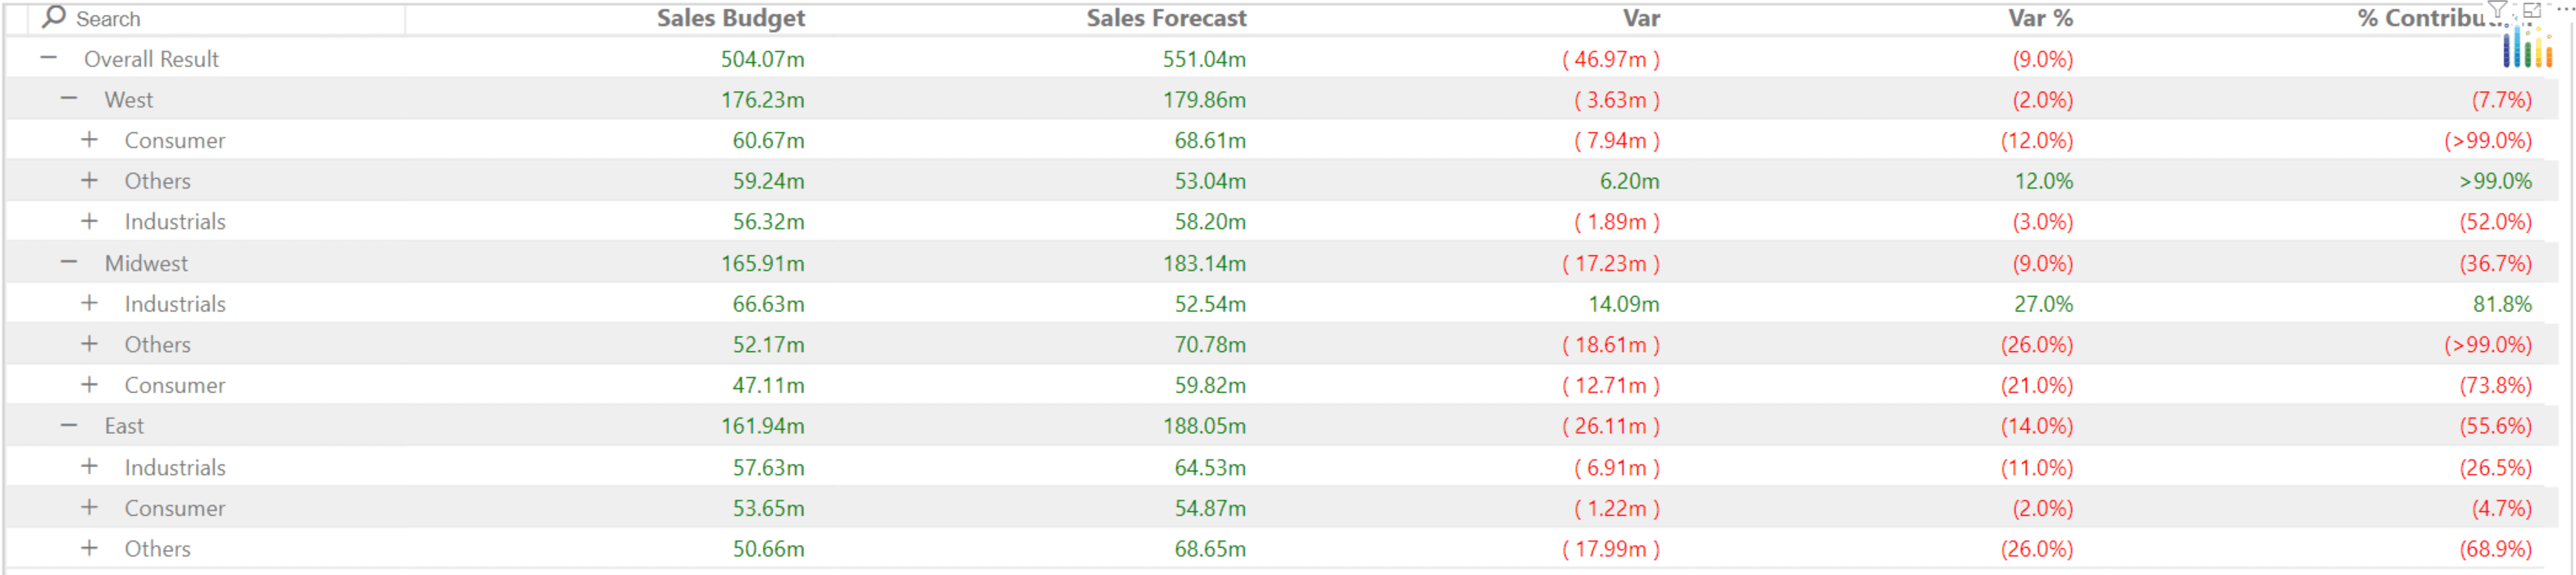
9. Percentage Variance based Conditional formatting
It is applied to each member by default. This can be controlled by using the % Variance threshold under the Conditional Formatting Section .
We have covered the key features of xViz Hierarchical Variance Chart so far but there is more.
***
To get the latest version of the custom visual, reach out to us here.
You can take a look at the other advanced custom visuals by xViz here.