This blog is part of the Gantt chart Blog Series.
We are excited to announce the latest release of our xViz Gantt chart (v3.0.1). In this release, we have incorporated many features that have been requested by our customers. You asked for it, you got it.
Latest Features – Summary
- Easier license management
- Option on visual canvas to expand/collapse all levels
- Time zone setting for ‘Today’ references
- Data fields for Sorting
- Data Grid Font Style
Latest Features – Description
1. Easier license management
You can buy the licenses directly from Microsoft AppSource. It will also enable license management from the Microsoft 365 Admin portal. More details are available here - Buy xViz Enterprise visual licenses directly from Microsoft AppSource.
2. Option on visual canvas to expand/collapse all levels
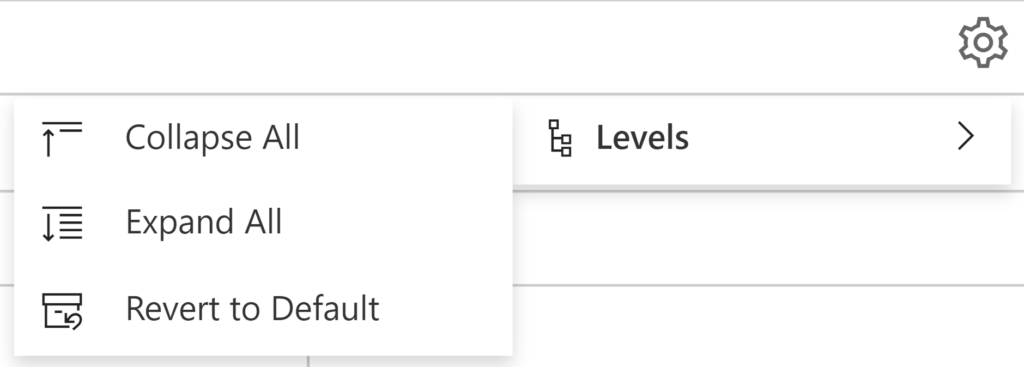
Report users may want to expand or collapse all the levels in the hierarchy of the Gantt Chart. We now provide the option on the visual canvas to expand/collapse all levels in the chart at once. As shown in the above image, the option is available in the Utility Menu -> Levels dropdown. There is also an option to revert the levels state to the default view, as it was on the report load.
To use this option, it needs to be enabled in the format pane:
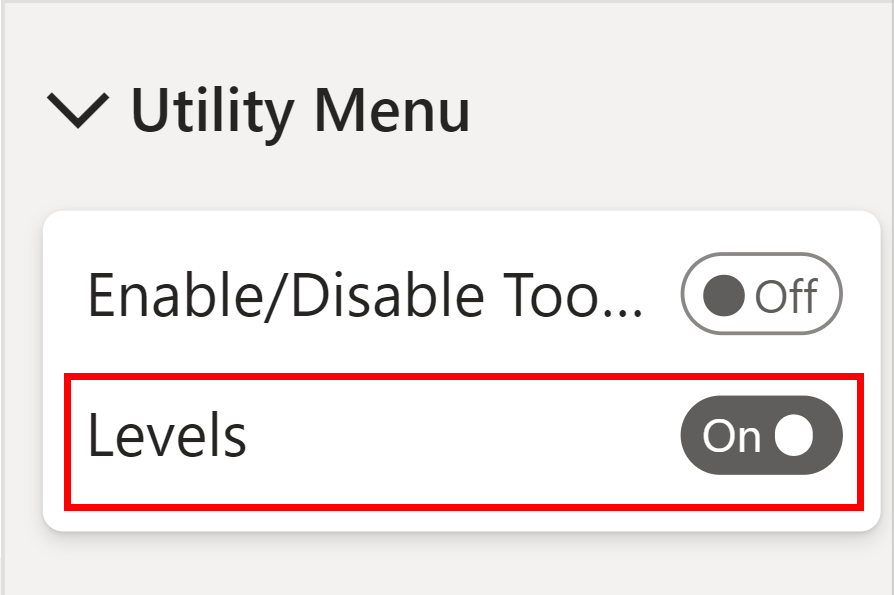
3. Time zone setting for ‘Today’ references
Our Gantt chart now provides the support to define the time zone to be considered while plotting the “today” (current date/time) reference. “Today” references can be plotted for reference lines or reference date ranges.
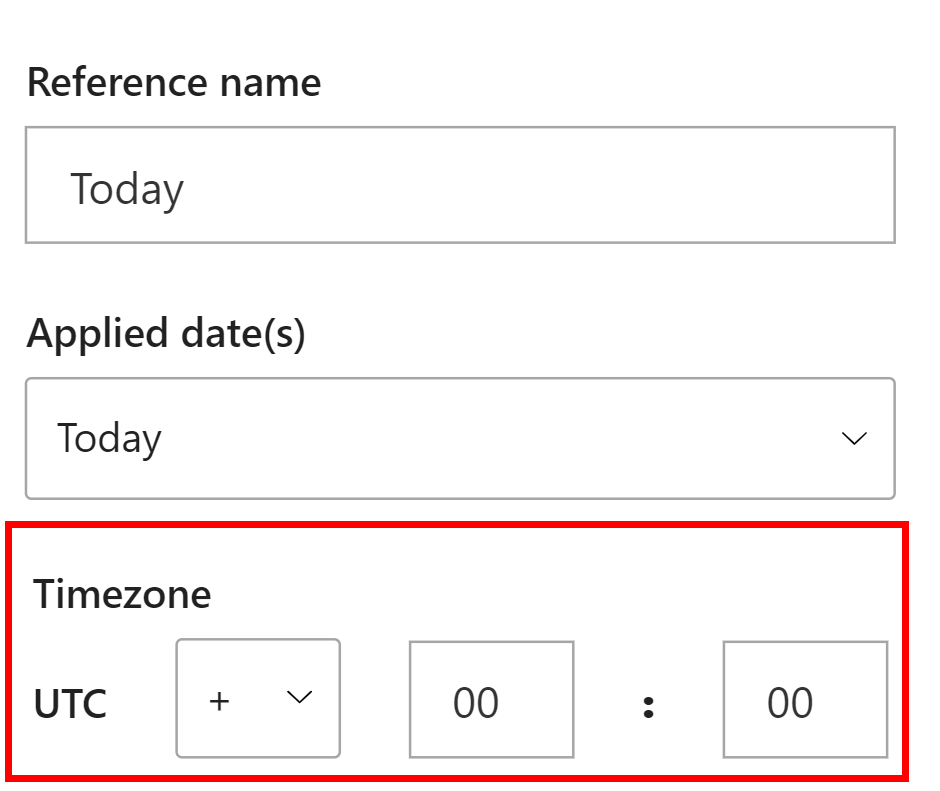
By default, Gantt used UTC, but now, it can be configured in the Advanced Editor settings of the respective reference.
4. Data fields for Sorting
Sorting has been made easier with the two new data fields introduced to easily sort the bars in the Gantt Chart
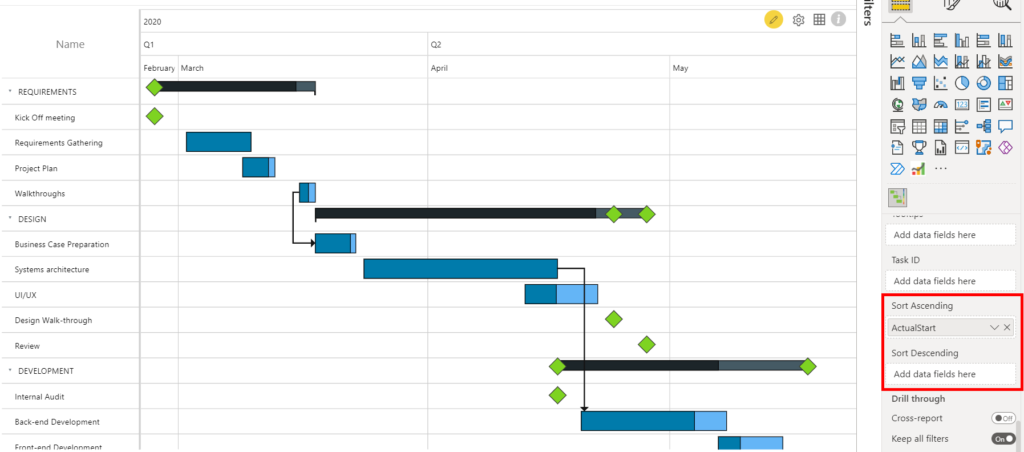
Insert the column that decides the Sort Order either in the ‘Sort Ascending’ or ‘Sort Descending’ data field based on the sorting direction to be applied based on the inserted column.
5. Data Grid Font Style
Customize the font style (Bold, Italics, Underline) of the category text using the new ‘Data Grid Font Style’ option provided in the Format Pane -> Data Grid section.
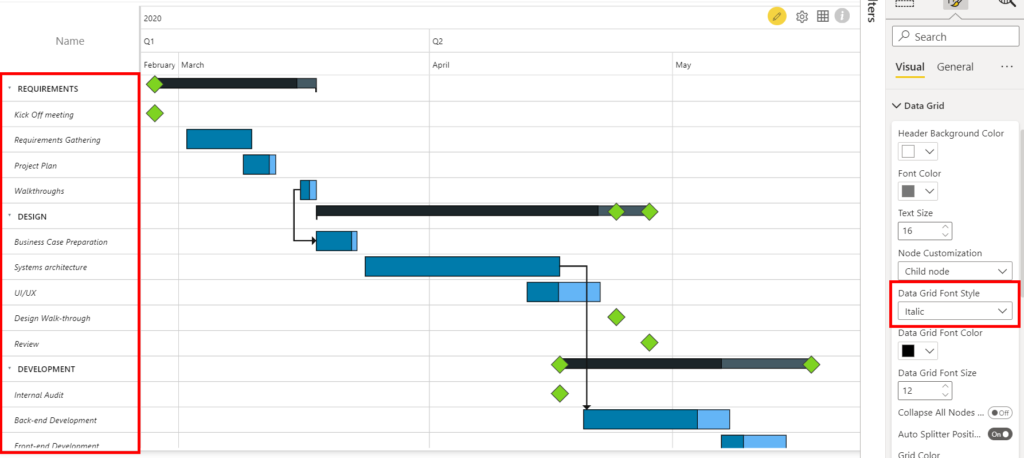
Use this option in conjunction with the ‘Node Customization’ option just above this option, to apply different font styles to Root, Parent, and Child nodes.
Download the latest version of the xViz Gantt Chart from Microsoft AppSource here.


