Have you ever wondered how can we visualize the timeline of various projects with multiple phases? With multiple ongoing projects, and each having to go through a series of phases, it becomes essential to visualize the plan in an effective manner.
Consider having the following data of four construction projects, each with five stages and the start and end for its execution in various phases:
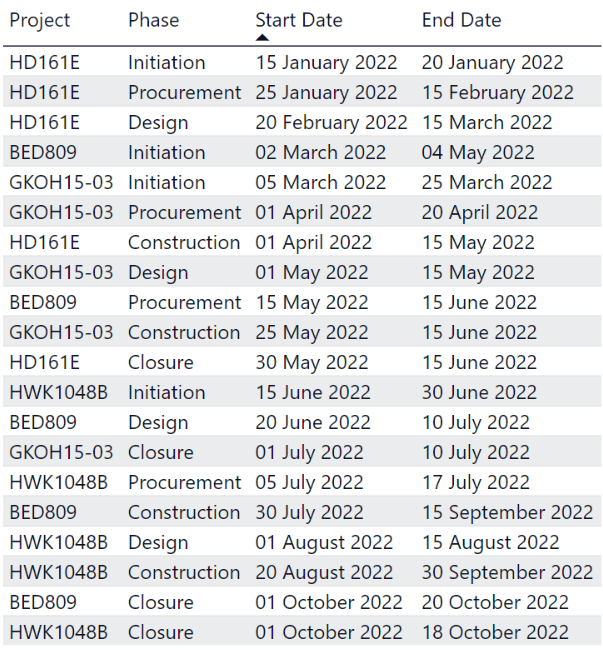
The xViz Gantt Chart below provides a standard and neat visualization to have the separate phases of one project in the same line. This Power BI custom visual helps you plan multiple projects in different stages in a single view.
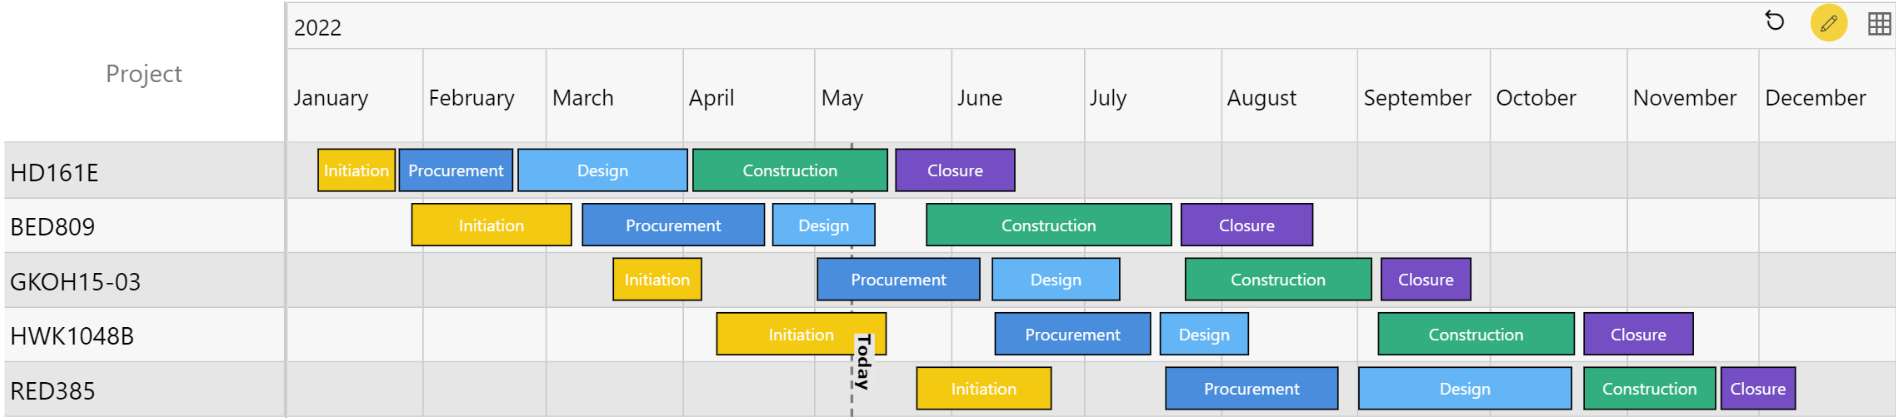
The above view gives a clear representation of the start-to-end execution time of all the projects and any gaps in their execution between multiple phases. It thereby highlights any wait times in the project execution, minimizing that wait time can expedite the project execution.
The timeline bars have been color-coded by the phase. This makes it easier to see any overlaps of multiple projects in the same phase at a given time. Further, phase overlaps would help in identifying the number of projects with a particular department at any given time.
Let’s take a deeper look at each of the features in the above visual and how to configure it:
1. Hierarchy View
Insert the following columns in the ‘Task Name’ data field:
- Category defining the rows – in this case, Project
- Category defining the phases in the timeline – in this case, Phase.

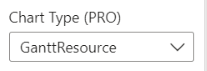
2. Multiple tasks/phases in one line
To plot the timelines bars related to one project in one line:
In the formatting pane, set the Chart Type to ‘GanttResource’
3. Color coding of the timeline bars
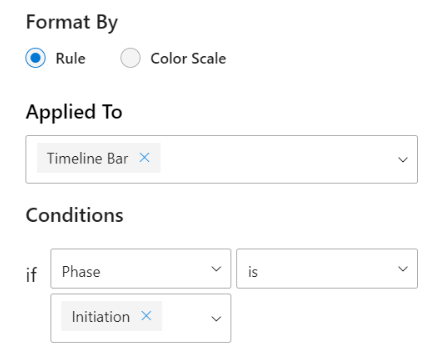
Use the Conditional formatting feature from the Advanced Editor:
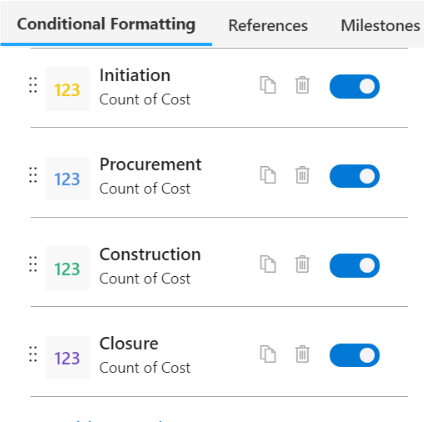
And define different rules for color-coding the timeline bars.
Conditional formatting can also be leveraged to color code different chart elements like a status flag, data grid text colors, etc.
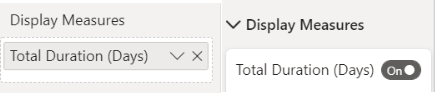
Please note that at least one value must be inserted in the Display Measures field to enable the Conditional Formatting feature. You may choose to disable showing the Measure in the visual by disabling it in the formatting pane.
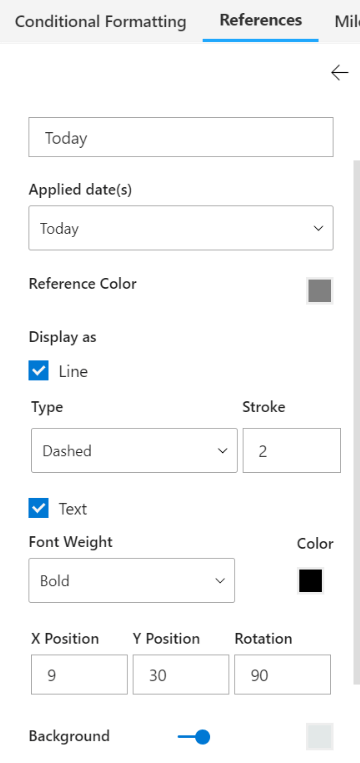
4. Reference today line
Multiple reference lines can be added in the visual – like Today (plots the current date), or even custom dates or date ranges to represent a key date across the data chart.
To add a Reference line, go to the ‘References’ tab in the Advanced Editor. And add a reference line. The snapshot below shows the configuration for adding a Today reference line.
Other than Project management, the Gantt Resource view (multiple timeline bars in one row) of the xViz Gantt Chart can also be helpful in various other scenarios like Resource Management.
You can check out the video - Visualize Parallel/ Integrated Resource Management in Power BI using Gantt Chart with an example of resource management using xViz Gantt Chart.