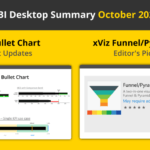
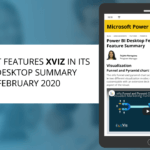
We are delighted to announce that our new xViz Advanced Trellis Visual along with the latest enhancements updates to the Gantt Visual – Enterprise Edition is featured in the Microsoft Power BI Desktop Summary Blog June 2020 Edition.
The blog highlights the key functionalities of the newly released Advanced Trellis Visual in the xViz Suite. They include:
- Trellis Mode: Chose between Splitting, Stacked charts and Animation options
- Display Top N Values and group the remaining as ‘Others’
- Pagination: Display multiple small trellises across different pages
- Average Panel: Display overall average across all panels or average values in a given panel
- 10+ different chart types with extensive customization and styling options
- Data Label customization: Choose between different data label formats and column totals
- Utility Menu: Change Panel layout and scale (Y-axis) on fly
- Interaction: Enlarge Panels and interactive legends
- Axis label customization: Rotate, Word wrap, Nth label and Stepped labels to support long labels
- Advanced conditional formatting: visually highlights outliers based on different rules
- Breadcrumb – Display for drill-down levels
- Drill down support
- Number formatting: enables customization of values based on various business scenarios
- Summary table: tabular view of data Download the Advanced Trellis Visual free for Power BI Desktop here and check out all the features offered by the visual.
To get the latest version of the advanced trellis (1.1.0), reach out to us here.
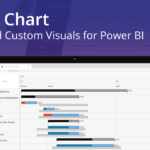
The xViz Gantt Chart now caters to some of the most requested features by enterprises like fiscal year support, ragged hierarchy support (hide blanks), aggregation for values in the data grid and other additional features listed below:
- Support for Ragged hierarchies – Filter blank
- Fiscal Year support
- Number formatting – Aggregation for values in the data grid (display measure)
- Conditional Formatting for the Parent node
- Conditional Formatting enhancements for Progress Bar
- Ability to set Multiple Reference Lines
- Reference Range
- Hyperlink Support
- Live editing and Write back scenario
- Multiple connector lines configuration
- Data label enhancements- offset and padding options
- Row numbering
- Display Totals
- Date Timeline formats
- Language support for Power BI
- Zoom Levels (advance editor)
You can take a look at the other xViz advanced custom visuals here.