It is the Quarantine period, and a lot of us are taking the couch during the weekends to watch movies and television series on Netflix. Sometimes, it becomes very cumbersome to spend hours of your free time scrolling around the menus in the Netflix sections, only to end up re-watching the same movies and shows again! The streaming service also provides suggestions based on our previous watch history and we fail to discover the hidden gems as we are led on by recommendations in our watch list.
This interactive Power BI Dashboard helps you to identify all the different sub-genres and niche selections that are not visible explicitly inside Netflix.
CLICK HERE to view the Power BI Dashboard
The enable External URL Feature in the visual helps you to access the Netflix Genres directly from inside the Power BI Dashboard. The steps mentioned below help you achieve it:
- Enable External URL Option in the xViz Multi Axes Visual
- Click on the Genre Label you wish to browse and confirm Navigation to Netflix
- Voila! You are now browsing the sub-categories present in the streaming service
Let’s now get an overview of the Power BI custom visual components that are used in the dashboard.
- xViz Hierarchy Filter
The xViz Hierarchy Filter /Advanced Slicer in the Power BI Dashboard is used to categorize all the genres present in a consolidated format. The Context Menu feature present in the Slicer enables you to Expand and Collapse All the data present and we can also re-arrange them based on topics in alphabetical order for easier navigation.
The Enhanced Search Option works seamlessly with high responsive capabilities that provide results in the hierarchies based on the search data. The descendant count is also displayed under each section of the hierarchy so that we get an overall insight on the data present.
The Enhanced Search Option works seamlessly with high responsive capabilities that provide results in the hierarchies based on the search data. The descendant count is also displayed under each section of the hierarchy so that we get an overall insight on the data present.
2. xViz Tag Cloud
The xViz Tag Cloud (or Word Cloud) Power BI Custom Visual gives you an intuitive way to represent textual data.

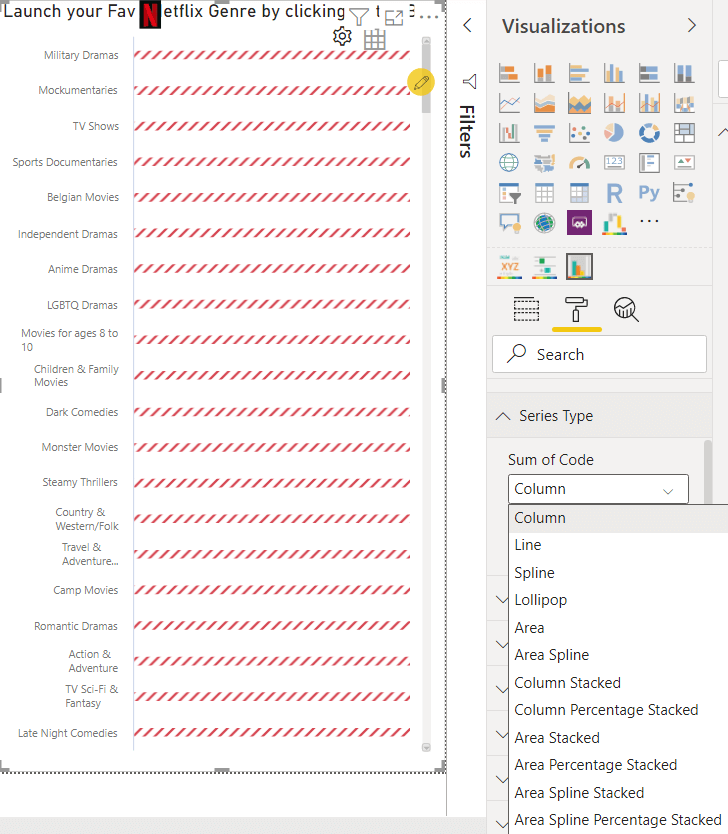
3. xViz Multi Axes Chart
The xViz Multi Axes Chart provides the code for multiple hidden genres presents inside Netflix. The visual can be typically used to display data in various formats – such as Column, Line, Area, Spline, Lollipop Chart, Area Stacked, and many more.
***
You can download the Advanced Visuals discussed above and all the Power BI Advanced Visuals of the xViz Pro Suite FREE for Power BI Desktop.
You can take a look at all the advanced visuals in the xViz Pro Suite here.