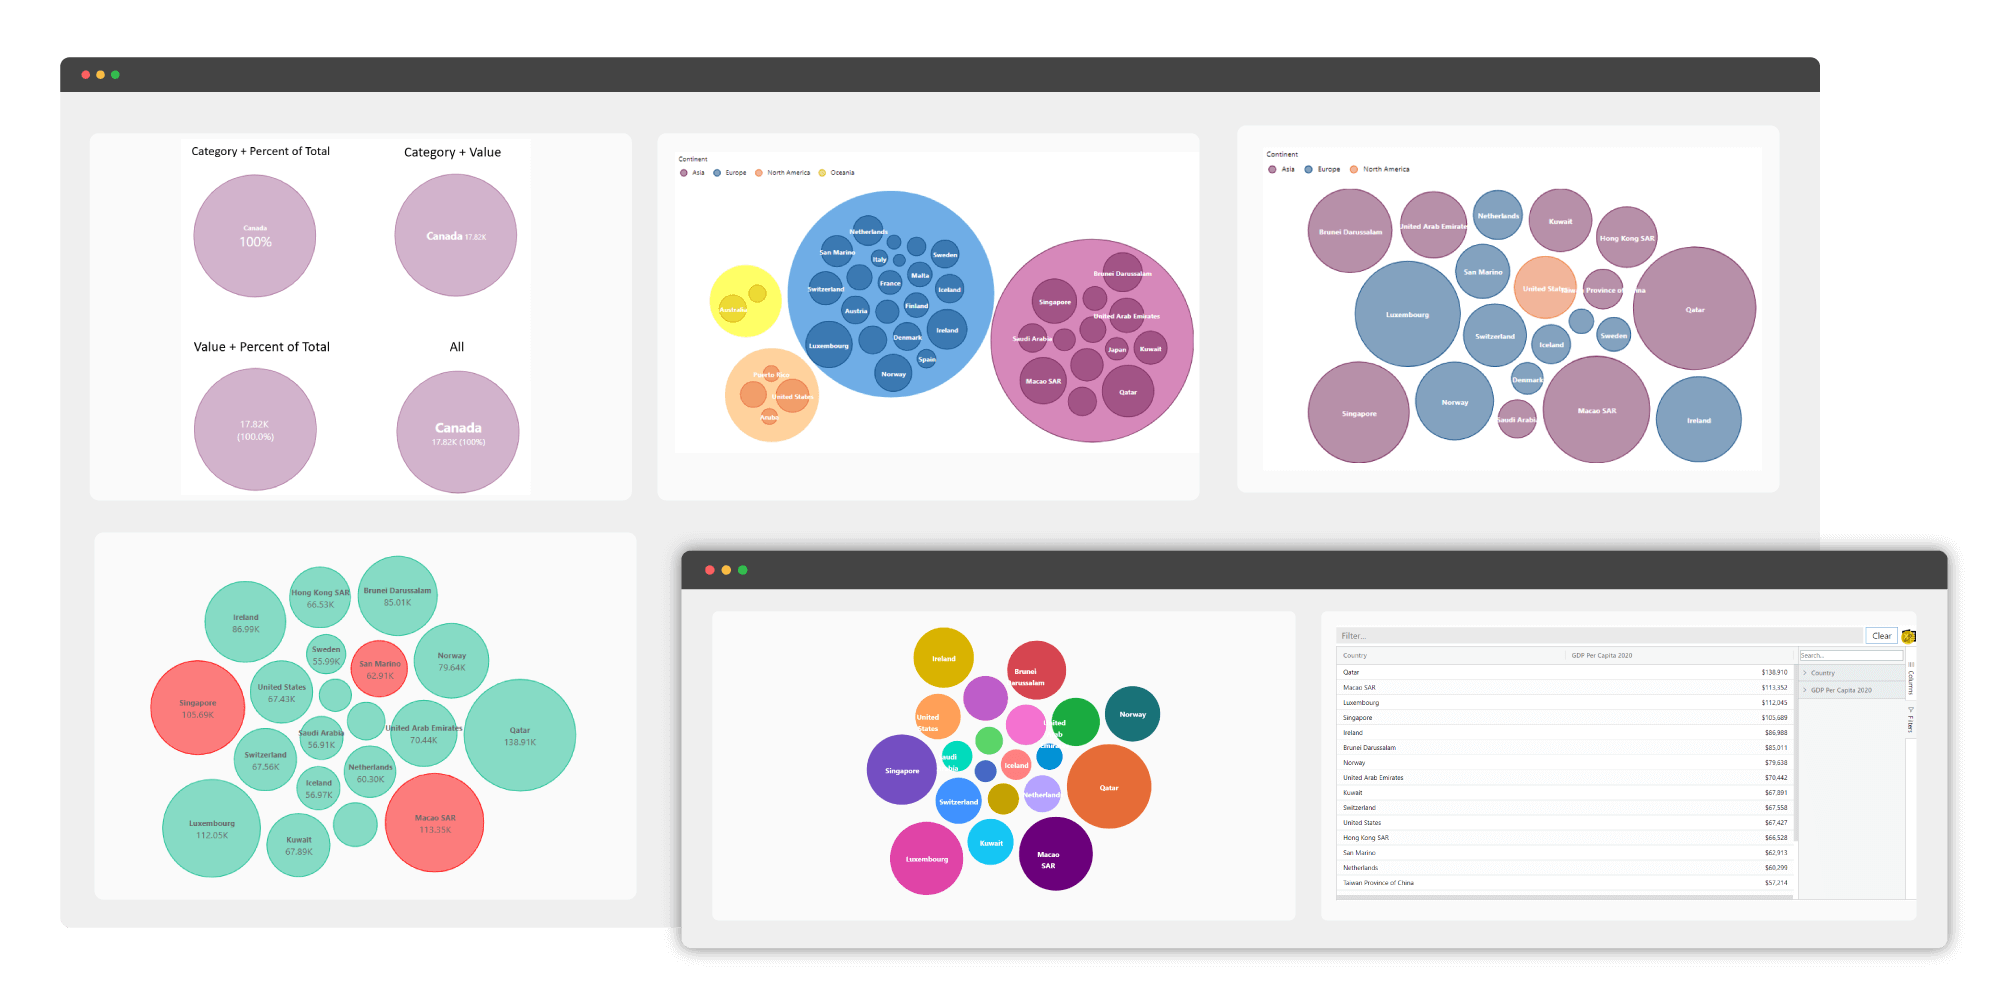
Packed Bubble, the xViz visual of the month May was highlighted in Power BI Desktop Summary May 2020 Edition. The key features of the custom visual showcased in the blog are as follows:
- Bubble Clustering and Grouping Capability based on assigned Legend field
- Data Label customization: Choose from different Data Label formats to display combinations of category, value, and percent of total
- Responsive text: Enables easier readability of data labels
- Advanced Conditional Formatting: visually highlights outliers based on different rules
- Bubble Size customization: Define the minimum or maximum bubble size
- Drilldown support
- Number formatting: Enables customization of values based on various business scenarios
- Summary table: Tabular view of data
The Desktop Summary Blog also discusses the recent updates xViz Hierarchy Filter/Slicer Power BI Visual and how the visual component is re-engineered to support a galore of new features that can be applied enterprise-wide.
Following are the additional features of the advanced hierarchy slicer visual:
- Ability to add value (measure) along with category
- Support for measure filter
- Conditional formatting: Alert induced selection (text and background)
- Search capability
- Support for ragged hierarchies: hide blank categories and values
- Single child display: customize tree structure with single child nodes
- Context menu for runtime capabilities like expand/collapse all nodes, enable/disable different conditional formatting rules, and rearrange nodes on the fly
- Node level formatting: Top node, parent and child
- Interaction customization: on hover and on node selection
- Display mode: list and dropdown
- Single and multi-select options
- Display child count
- Hierarchy icon customization: arrow, plus/minus
- Default expand to a particular level
- Appearance tab: customize filter look and feel
- Column header for category and value
***
You can download the Advanced Visuals discussed above and all the Power BI Advanced Visuals of the xViz Pro Suite FREE for Power BI Desktop.
You can take a look at all the advanced visuals in the xViz Pro Suite here.